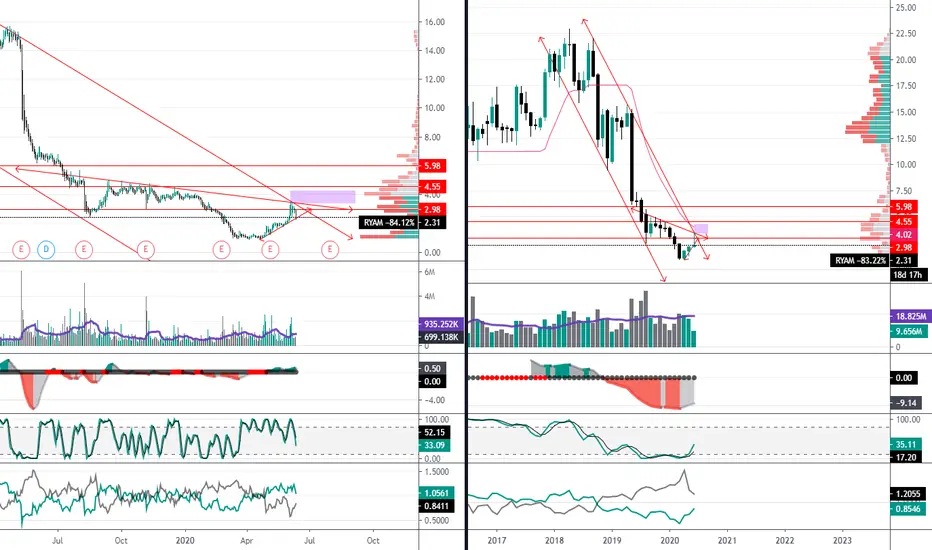
Ready for upsideThe stock appears to be in a pullback phase. I anticipate it will find support around the previous monthly highs, keeping prices contained between that level and the anchored VWAP (Volume-Weighted Average Price) from the recent swing high. Once the price advances back up toward this anchored VWAP an
Next report date
—
Report period
—
EPS estimate
—
Revenue estimate
—
−1.05 USD
−37.85 M USD
1.63 B USD
63.52 M
About Rayonier Advanced Materials Inc.
Sector
Industry
CEO
DeLyle W. Bloomquist
Website
Headquarters
Jacksonville
Founded
1926
FIGI
BBG005XVML66
Rayonier Advanced Materials, Inc. engages in the manufacture of high purity cellulose, paperboard, and high-yield pulp products. It operates through the following segments: High Purity Cellulose, Paperboard, and High-Yield Pulp. The High Purity Cellulose segment manufactures and markets high purity cellulose, which is sold as either cellulose specialties or commodity products in the U.S., Canada, and France. The Paperboard segment produces lightweight multi-ply paperboard products. The High-Yield Pulp segment is involved in the production of bulky high-yield pulp. The company was founded in 1926 and is headquartered in Jacksonville, FL.
Related stocks

RYAM Long Idea - Daily - Target is $16.00 by Oct 29thSimilar setup to that last push up with the divergences. That support buying area goes all the way back to a double bottom in 9/2015 + 2/2016. Price also wicked into this area when forming the descending wedge that it is in.
I see the first lighter targets getting hit quickly before there is a ret

$RYAM looks set up for an easy 36% gain from gap and earnings$RYAM has a nice gap from May2019 and just had good earnings report. If it breaks the 618 fib it should be an easy run to the 718 for 36%! Options are available as well!

$RYAM still on uptrend with growing support. Pivotal moment!RYAM has support on a trend line and the 20MA, hopefully it continues upward! If it breaks downward, it might hurt until it can find support maybe around the $6-$8 range.

RYAM - Long at Last - *ON HIGH ALERT FOR WEEK*I have been watching RYAM for a longg time waiting for this breakout and its coming and its going to explode like GCI did. You obviously want to trade BOTH trend breaks. So you entry is a full candle AND retest of these breaks will update later. I have 4 alerts including volume alert.
RYAM long setupAfter the release of good financials on Feb. 24, there is a significant increase in volume in RYAM. Many buyers have entered the market here.
This results in a nice setup for a swing trade of several days in the daily chart.
The overriding trend in the weekly chart also confirms the current mark


RYAM BullishMACD crossing over as is the 9ema over the 20ema. Id like to see it hold the 8.65 level. First target 9.29 Swing target: 12.53

RYAM has about 60 % potentialRYAN is below in the channel and has about 60 % potential.
Both CCI and STORSI looking good.

$RYAM $6.00 reclaimed, upside should resumeTop (daily): RYAM has pulled back into the all important $6.00 level and the upper side of the rising parallel channel, which is now holding as support after twice before acting as resistance
Bottom (weekly): longer term context of $6.00 level, if RYAM can stay above it, the stock could complete th

See all ideas
Summarizing what the indicators are suggesting.
Neutral
SellBuy
Strong sellStrong buy
Strong sellSellNeutralBuyStrong buy
Neutral
SellBuy
Strong sellStrong buy
Strong sellSellNeutralBuyStrong buy
Neutral
SellBuy
Strong sellStrong buy
Strong sellSellNeutralBuyStrong buy
An aggregate view of professional's ratings.
Neutral
SellBuy
Strong sellStrong buy
Strong sellSellNeutralBuyStrong buy
Neutral
SellBuy
Strong sellStrong buy
Strong sellSellNeutralBuyStrong buy
Neutral
SellBuy
Strong sellStrong buy
Strong sellSellNeutralBuyStrong buy
Displays a symbol's price movements over previous years to identify recurring trends.
Frequently Asked Questions
The current price of RYAM is 3.63 USD — it has decreased by −5.47% in the past 24 hours. Watch Rayonier Advanced Materials Inc. stock price performance more closely on the chart.
Depending on the exchange, the stock ticker may vary. For instance, on NYSE exchange Rayonier Advanced Materials Inc. stocks are traded under the ticker RYAM.
RYAM stock has fallen by −15.19% compared to the previous week, the month change is a −9.70% fall, over the last year Rayonier Advanced Materials Inc. has showed a −45.58% decrease.
We've gathered analysts' opinions on Rayonier Advanced Materials Inc. future price: according to them, RYAM price has a max estimate of 7.00 USD and a min estimate of 6.00 USD. Watch RYAM chart and read a more detailed Rayonier Advanced Materials Inc. stock forecast: see what analysts think of Rayonier Advanced Materials Inc. and suggest that you do with its stocks.
RYAM reached its all-time high on Jul 16, 2014 with the price of 44.18 USD, and its all-time low was 0.90 USD and was reached on Apr 3, 2020. View more price dynamics on RYAM chart.
See other stocks reaching their highest and lowest prices.
See other stocks reaching their highest and lowest prices.
RYAM stock is 6.67% volatile and has beta coefficient of 1.52. Track Rayonier Advanced Materials Inc. stock price on the chart and check out the list of the most volatile stocks — is Rayonier Advanced Materials Inc. there?
Today Rayonier Advanced Materials Inc. has the market capitalization of 242.39 M, it has decreased by −8.24% over the last week.
Yes, you can track Rayonier Advanced Materials Inc. financials in yearly and quarterly reports right on TradingView.
Rayonier Advanced Materials Inc. is going to release the next earnings report on Aug 5, 2025. Keep track of upcoming events with our Earnings Calendar.
RYAM earnings for the last quarter are −0.49 USD per share, whereas the estimation was −0.09 USD resulting in a −444.44% surprise. The estimated earnings for the next quarter are −0.23 USD per share. See more details about Rayonier Advanced Materials Inc. earnings.
Rayonier Advanced Materials Inc. revenue for the last quarter amounts to 356.00 M USD, despite the estimated figure of 385.00 M USD. In the next quarter, revenue is expected to reach 385.50 M USD.
RYAM net income for the last quarter is −31.95 M USD, while the quarter before that showed −16.00 M USD of net income which accounts for −99.70% change. Track more Rayonier Advanced Materials Inc. financial stats to get the full picture.
As of Aug 2, 2025, the company has 2.35 K employees. See our rating of the largest employees — is Rayonier Advanced Materials Inc. on this list?
EBITDA measures a company's operating performance, its growth signifies an improvement in the efficiency of a company. Rayonier Advanced Materials Inc. EBITDA is 190.81 M USD, and current EBITDA margin is 13.17%. See more stats in Rayonier Advanced Materials Inc. financial statements.
Like other stocks, RYAM shares are traded on stock exchanges, e.g. Nasdaq, Nyse, Euronext, and the easiest way to buy them is through an online stock broker. To do this, you need to open an account and follow a broker's procedures, then start trading. You can trade Rayonier Advanced Materials Inc. stock right from TradingView charts — choose your broker and connect to your account.
Investing in stocks requires a comprehensive research: you should carefully study all the available data, e.g. company's financials, related news, and its technical analysis. So Rayonier Advanced Materials Inc. technincal analysis shows the strong sell today, and its 1 week rating is strong sell. Since market conditions are prone to changes, it's worth looking a bit further into the future — according to the 1 month rating Rayonier Advanced Materials Inc. stock shows the sell signal. See more of Rayonier Advanced Materials Inc. technicals for a more comprehensive analysis.
If you're still not sure, try looking for inspiration in our curated watchlists.
If you're still not sure, try looking for inspiration in our curated watchlists.