$SE - looks like its in wave 5 of cycle IIISE looks like it is in a wave 5 of a cycle III. This would make sense with how crazy of a show it has put on. What I am seeing is a conservative PT of 390 for this top, but it could go well into the 400's. (if my count is correct).
From there we will see a retracement (likely 23.6) for the wave IV which is going to be in that channel zone. Any dip into that channel is a buy as SE has bounced hard out of it numerous times. I would draw and alert it on your chart.
SE trade ideas

Khan's Swing-Trade Idea KW 47 - $SEAlways has the potential run after earnings – your risk if you start a position before.
Communication is a lagging sector at the moment, with good volume next week this could be a nice play.

SE came back on the right track - BUY Opportunity1. Long-term up trend
2. Reacted nicely with EMA 20 with higher volume than average, yesterday.
3. Closed with a bullish candle which acts as a confirmation candle


SE- Broke out the descending triangle SE - Broke out the descending tringle ,continued on follow through day.
It may reach all time high

SE - 11.01.2021SE hit all-time highs recently and pulled back to key EMA levels. Price broke above it's resistance trend line but the big breakout is over the 355 area.
370, previous high, is our first target, then 400 psyche level should be a magnet.
Manage risk using, intraday timeframes (15min, 65min).

Sea Ltd stock analysis w/ boxes and Volume ProfileHi everyone,
This time I am analyzing NYSE:SE stock movement using volume profile besides my usual boxes setup.
NYSE:SE stock price has shown very persistent up-trend strenght for the past year.
When we have the equity soaring up like NYSE:SE does, it is helpful to use Volume Profile to see a bigger picture.
I added three volume profiles for different timeframes: 9 months, 5 months and 2 months.
What does it show us?
As we can see in the past 9 months the biggest trading volume occured around 273 level. That is where our long-term POC is.
However, a decent volume profile started developing from 308 level and above.
For the last 4 months the highest volume has been seen at 323 level. Both 2 and 4 month profiles have universal volume distribution with same POC level.
That means that higher price level has been accepted and stock is consolidated on a higher time-frame.
What now?
As volume profile is dynamic, I expect long-term POC to migrate to 320 level.
However, for that to happen we will need to see a lot of volume at 320, which is 7% lower than the current price.
AND that would be happening at the uptrend support line, which is dangerous.
IF that is broken, we could see a return to 273 POC to repair long-term profile structure.
IF we continue higher from here, we would get unevenely distributed profile, which could be bad in the long-run.
Let me know what you think of NYSE:SE movement and if it is sustainable.
Trade wisely and good luck!
-----------------------------------------------------------------------------------------------------------------
Disclaimer!!!
This is not financial advise.

Sea Limited Expected to fall with the completion of 5 wavesAs detailed in the chart, the purple waves are my primary counts. Note that there is a certain bias on my part for favoring short and thus the Fibonacci extension is used to justify the 3rd wave within the V wave. However, in the event that my bias is proven wrong, expect another wave up (red waves showed the 3rd wave) and coming fall to be only the 4th wave of the V wave.

SE (SEA Limited)SE has been in a protracted bull run for more than a year.
Breaking ATH again.
I am already short BKNG and it is going ok.
I somehow feel reluctant to put on another short.
I think shorting here ~360, TP 310 / 300 region, tight stop loss around 380 should be fine.
I think the trade is sound.
Its just a matter of whether I still have the risk appetite.

$SE | WEEKLY WATCHLIST 10/17Simple chart here for this one. I wanted to keep this one simple. All eyes on the key $160 level. Please take note of the Weekly MACD bullish bounce as well as an increase in bullish volume to support the bounce. This indicates buyers stepping in. We have the Weekly RSI downtrend resistance approaching and looks to test very soon. There, we will get clear direction if we will full send higher, or find yet another local top rejection.
I will enter a long position on the break of key $160 level this week. Target above is $165, $170.

Bullish- Triangle breakoutSE is looking quite nice here, been watching this one for a while- will be looking for a breakout from this pennant (broader market conditions permitting). Just some support and resistance levels and some RSI-based supply and demand zones to keep an eye on- Bullish
- Clean hammer & bounced right off the 20-day EMA on the 4-hour timeframe, other EMA's starting to curl upwards as well (See Carts Below)
- Buyer volume starting to pick up relative to seller volume
- MACD cross on the 4-hour
- Ascending triangle on shorter timeframes
- Slight bullish divergence on the RSI
PT1- $344.03
PT2- $346.48
PT3- $348.90+ Breakout

Flag buildingneeds another good push to breakout but has held up very nicely when market pulled back


SE forecastWhat it could go to (Bias). this is long term hold position and could get you to earn a lot of money.

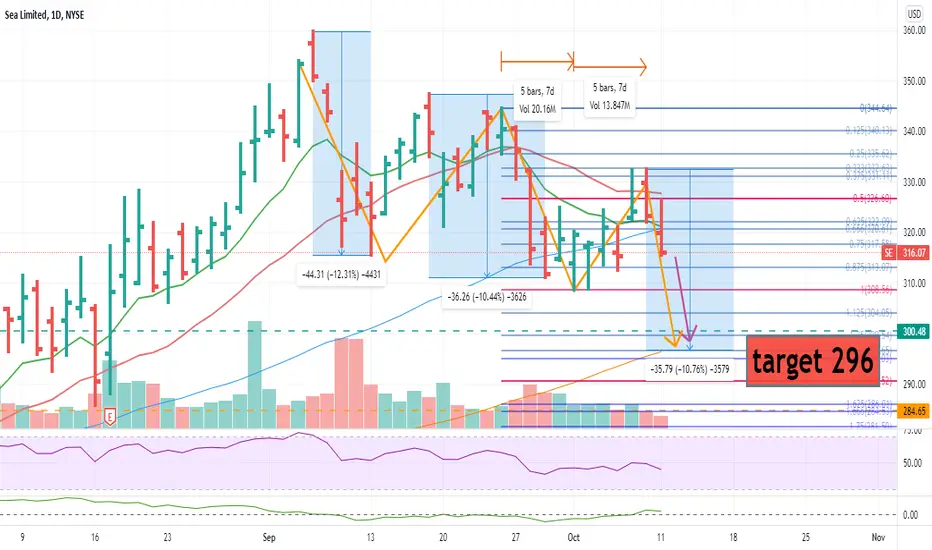
$SE final leg down$SE is going on it's final wave of ABCDE.
FINAL TARGET PRICE SHOULD BE AROUND 296.
Using price range, the down range are of equal ranges A & C, expecting E to be around the same range.
SEA LTD - Everything looks fine! 🤔-Free Fire is good, e-commerce is good, financial services are doing good. Why to drop?
-In recovery we trust! Let's wait and see.

SE bearishWe are already in the pattern where it can go down. Although the stock itself is very strong so wont short until get multiple confirmations.

SE Correcting Fell outside of its uptrend (Purple lines) I dont think Cathie will let this fall below 275.


SE - Will SE flip the EQ of the ascending channel?I believe SE is about to flip the EQ from resistance to support and head to the top of the channel.

SE BearIt pains me to say this as its my largest holding but I went short on $SE yesterday at the top because of three reasons. (1) it was curling upwards in an exponential fashion looking like it wanted to put in one blow off top before it fell. (2) It was extended from the 8 ema the same amount it always is when it pulls back. and (3) The market is ripe for a pull back. I went with 9/17 $340 puts which I sold today but it looks like we've now fallen more after hours so I think I'm going to play another put tomorrow for $325 for it to head to the 21 ema. It'll be my hedge to keep my shares intact.

SE Watching SE stock here, possible consolidation until mid-october before ripping back up grandpa style

$SE with a Bullish outlook following its earnings #Stocks The PEAD projected a Bullish outlook for $SE after a Positive Under reaction following its earnings release placing the stock in drift A.
If you would like to see the Drift for another stock please message us. Also click on the Like Button if this was useful and follow us or join us.
