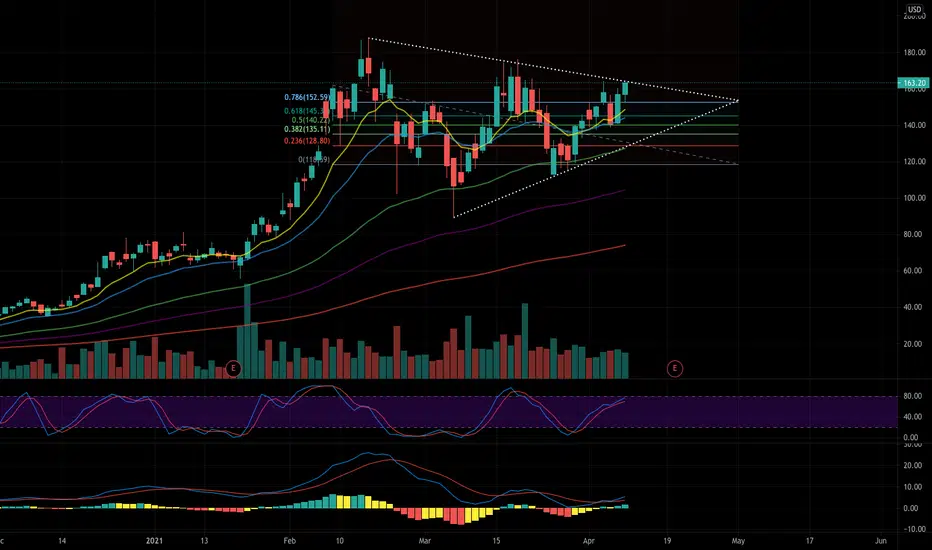
SI Short oppurtunity showing up on PTPPTP is past trend prediction that finds the same move in the past.....
this is different than the below...
I made a key code of the price action then found an exact match to this move in the past.... one that matched at lease 95% or better. That way if the move is that close to the same shape we have now it must mean the sentiment of the market was the same at that time. Therefore, the outcome should be the same coming out of the move. I then used PTP which is Past Trend Prediction by tracing the trend it made after this move in the past and projecting it forward on to the current move.
Then I took the same move on the Daily which is a different Time frame then the first..and found the same move with out a key and traced its path and projected it forward as well.
Sometimes I use about 5 other Price Action tricks I have have developed over the last 10 months or chart out the Curve and what Stage it is in. The Curve is my own brain child and I compare that to Wycoff method. Taking all of these into account You have several different approaches to confirming direction and intent of the institutional buyers and where Retail resides during this move.
If you would like to have more information or videos on Any of the ways I chart pls comment below. Like, follow, Subscribe...share.
Thank you,
iCantw84it
06.08.2021
SI trade ideas


$SI Silvergate - Oversold Bullish Hammer$SI Silvergate Capital - Hitting the bottom of its recent range with a possible bullish hammer candlestick. High probability of a near term bounce.
Bullish Unusual Options Activity:
$2.1M of May $110 calls bought today (7x open interest)
Near term target: $160-$170 range possible by early May
Note: This is NOT investment advice. Educational only.

Know What to Trade & What Not to TradeAnnotations on the chart. Lean to spot the difference, focus on calm and orderly chart patterns and you will succeed as a trader. This is not a chart you want to participate in.

Silvergate - Symmetrical TriangleLooking at Silvergate Capital Corporation hourly chart it still is looking a little choppy, will be waiting for a slight retracement and then will go long if I am able to get filled at a good price. Looking at the daily, silvergate looks ready for take off.

BUY $SI Still getting the hang of the Elliot waves but came up with this, starting position here, happy trading/investing my friends

$SI Breakout!I've been watching this after it's pullback and waited for it to break the horizontal trend line before entry. I was looking at that line as being somewhat of a Darvas Box... You can see my entry and stop on the chart. I think this will continue to challenge old highs. TBD. Ideas, not investing / trading advice.

SISi Signor! I have that green line as my target...
Come on let's do it amigos and amigas!
Si si si si......

SI could come down lower before reversing. This could reverse from here but i personally wouldn't buy until it gets into the green zone or bounces off the 21W MA. RSI has been coming down. Good volume. Possible entry here for risk takers. Not financial advice. DYOR.

SI SILVERGATE ALL TIME HIGHI will normally buy when price breaks ALL TIME HIGH. In this case, I am preempting that price will break all time high. It is probably 2-3 days early but I am going to buy when regular market opens.


Silvergate could become Capital OneSilvergate could become Capital One
From out of no where and then right to the top for its early investment in Crypto.
but i do see a 20% correction pattern - but maybe this time its different
not financial advice
for example i thought it would fall yesterday and it did not - i was wrong.
maybe next week? who knows ? not me!


silvergate rise and drop patternI like patterns and I see one here
maybe we dip back a bit before this moves higher
but what do I know ?

Silvergate will grow is bitcoin services business more soonSilvergate will grow is bitcoin services business more soon
As bitcoin grows they will get more clients and they will grow.
I am not a financial advisor just a bitcoin person.

Here's How I Doubled My Money on Silvergate Capital Corp ($SI)I sold half of my position on a double of $SI yesterday. I'm now in a risk-free position for life. I bet only a small size, but I think small is the way to go for longevity in this game.
I took this trade for two reasons: Fundamentals & Technicals. I'll break down both.
The Six Most Important Fundamentals
Firstly, the six most important fundamentals looked good. You can take a look at the fundamentals, here .
The fundamentals are broken down into six categories
Value
Dilution
Cash
Debt
Growth
Effectiveness
Here are some metrics for $SI:
Value
P/B: 1
P/E < 20
Dilution
< 25 million shares out
Cash
P/C < 5
P/FCF < 5
Debt
D/E: 7
Long-term D/E: 0
Growth
Quarterly Revenue Growth > 5%
Quarterly Earnings Growth > 20%
Effectivness
Return on Assets > 0%
Return on Equity > 0%
Return on Capital Employed > 0%
These six fundamental criteria cover virtually all aspects of a stock's fundamentals, and it's the best way to get a clean, holistic view of a business.
These six fundamental criteria all kinds of stocks, whether they are high-growth, value-based, dividend-paying, small-cap, etc
Sometimes, businesses may have high debt (like this one).
However, if they have good cash-flow, that, in some ways, balances the high debt.
Why? Good cash-flows will be used to pay off the debt.
On Risk And Relax , you can choose the fundamental factors that you think are the most important, and ignore the rest.
This way, you can cleanly analyze a business without the noise.
In this case, $SI had a good score of over 65% when considering all six fundamental criteria.
Now, let's look at the technicals.
The Most Important Technicals
There are several technical indicators, but in my opinion, the most important "indicator" is market structure.
In other words, is the price shows signs of a bottom?
I want to see the price in the shape of a 'W'.
And around April of this year, that's exactly what I saw.
The Bottom Line
All other technical indicators are fine, but they add noise.
The goal should always be to subtract noise.
And the best way to do this is to focus solely on price action (market structure) and the six key fundamentals.
If both are a go, then I feel comfortable buying!
So, that's what I did. I bought @ $9, and I sold half of my position when the price hit $18.
I had the conviction to keep holding because of the fundamentals.
I hope this helped.
I also made a YouTube video on this investment. Check it out!

Silvergate the bank for CryptoSilvergate the bank for Crypto
If you wonder where the exchanges ans hedge funds keep their USD - here is your answer.
Has crypto had a good year? Did Silvergate make money and will they have made money this fall?
I think so But I am not a financial advisor

Silvergate CapitalSilvergate Capital
They have been doing well but look for lower prices in coming weeks.
They could be lending money to the Next big thing today that will get us out of a jam tomorrow.

SI Weekly Analysis 1/28/2014Consolidation earlier than I had expected (I was expecting consolidation to occur about $5 higher). $130 is the floor, and $146 is the roof. Expect $146 to be a tough break as it represents multi-year high. Note, SI goes Ex-div tomorrow.

SI Weekly Analysis 12/28/2013Long since $100. Expect long term resistance at $146 to be challenged by Jan or Feb 2014.

