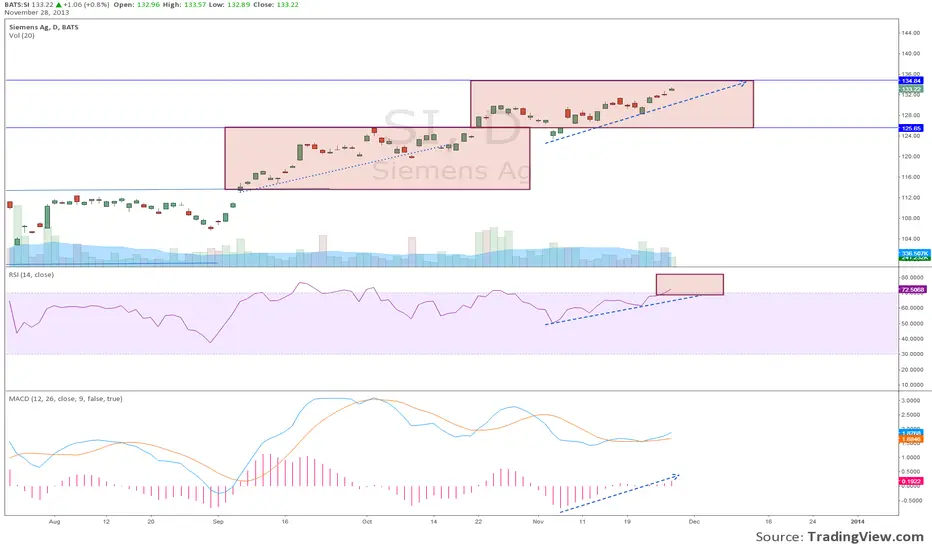
SI 11/28/2013 Daily AnalysisSI has been performing well in the past 4 months, recovering from the low 100s to 130s. I expect the bullish trend to continue, and expect to test the resistance at $134-135 by early to mid December. No reason to short here.
SI trade ideas
SI Daily Analysis 10/25/2013Continuation of bullish pattern since $100.
Since Sept, SI has advanced into the $112-$125 trading zone (for detailed analysis, please see my previous posts). Earlier this week, SI broke out of resistance at $125, now heading into the next phase. MACD and RSI both support bullish thesis. Based on prior trends, I think the next resistance is at $134-$135 area. Long and steady.
Disclosure: LONG SI since $100ish.


SI Daily Analysis 10/12/2013This is a chart based on a previously made chart, Study of Gaps published 9/18/2013
Overall, based on analysis of measuring gap, being the halfway point of the price movement, the resistance was calculated at $125-126. This proves to be surprisingly accurate, as it played out in the weeks following the analysis.
Overall, the momentum and price both experienced some recovery (not big of a hit from the macro issues comparing to the domestic stocks). I expect MACD and RSI to both continue to recover, and I expect the stock to retest the resistance at $125. Fingers crossed.

SI Daily Analysis 9/18/2013Confirmation of bullish break out and study of gaps
Break out of consolidation zone $96-112 occurred last week, with break out of long term resistance at $112 with above average volumes. It is confirmed in the days following it and this week Now $112 is acting as a firm support. The next meaningful resistance is at $125.
This chart is also a demonstration of different types of gaps
Breakway gap : It occurs when prices break away from an area of congestion. When the price is breaking away from a triangle (Ascending or Descending) with a gap then it can be implied that change in sentiment is strong and coming move will be powerful. One must keep an eye on the volume. If it is heavy after the gap is formed then there is a good chance that market does not return to fill the gap. When the price is breaking away on a low volume, there is a possibility that the gap will be filled before prices resume their trend.
Common gap : It is also known as area gap, pattern gap or temporary gap. They tend to occur when trading is bound between support and resistance level on a short span of time and market price is moving sideways. One can also see them in price congestion area. Usually, the price moves back or goes up in order to fill the gaps in the coming days. If the gap is filled, then they offer little in the way of forecasting significance.
Exhaustion gap signals end of a move. These gaps are associated with a rapid, straight-line advance or decline. A reversal day can easily help to differentiate between the Measuring gap and the Exhaustion gap. When it is formed at the top with heavy volume, there is significant chance that the market is exhausted and prevailing trend is at halt which is ordinarily followed by some other area pattern development. An Exhaustion gap should not be read as a major reversal.
Measuring Gap : Also known as Runaway Gap, a Measuring gap is formed usually in the half way of a price move. It is not associated with the congestion area, it is more likely to occur approximately in the middle of rapid advance or decline. It can be used to measure roughly how much further ahead a move will go. Runaway gaps are not normally filled for a considerable period of time.

SI daily 9/6/2013Nice break out of consolidation!
SI has been sandwiched in a huge zone of consolidation, between $98- $112 for the past year. The strong resistance is marked by the 50% retracement at $112 area. However, today, we see a strong break out of consolidation, supported by heavy volume. I expect that it will continue its course up (assuming no macro breakdown of the market). The next resistance is likely to be the 61.8% retracement at $120.

SI 8/9/13 Renko chartOn Renko chart here, SI break through the resistance at $108. It looks like a bull flag that has been confirmed with 2 boxes above the resistance line. I expect the bullish run to continue to the low $120s, where another zone of consolidation area will be established around $115-$120.

SI 7/21/2013 (weekly analysis)I plotted the chart on the Fib grid to analyze support and resistance levels. As you can see here, $95 (38.2% retracement) has been the strongest near term support, followed by $101 (50% retracement). We had a fabulous week, finishing the week at $109, which corresponds to 61.8% retracement. Note, last time it approached this level, it was sharply rejected, then was followed by a downtrend, until it found the support around $95. Next week is the key. If it is unable to break out, I expect another downtrend, heading toward $101, and possibly $95. I am optimistically cautious, however, as MACD demonstrates a bullish divergence. Good luck everyone.
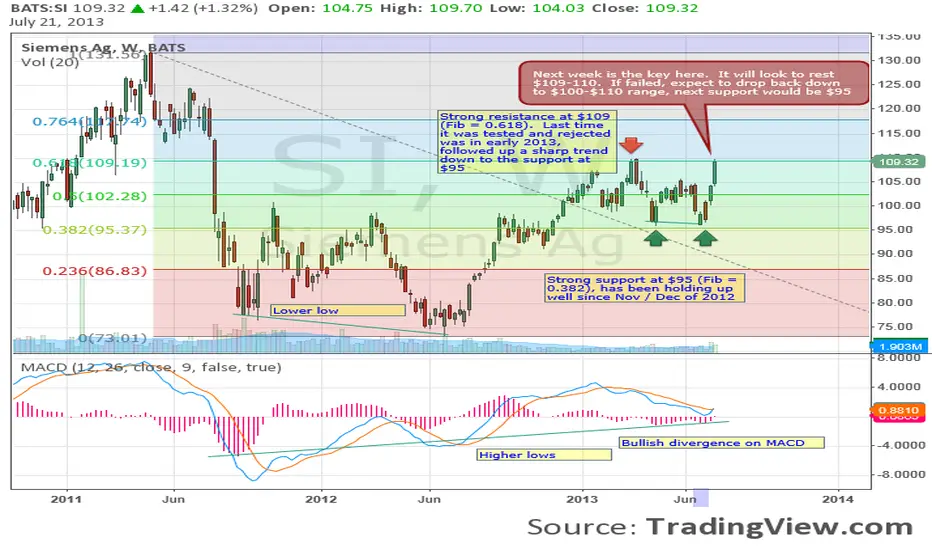
SI 7/21/2013 (W)Here is a weekly chart for SI. I plotted on the fib grid to look at the near and long term supports and resistances. What I want to point out here is that we finished the week at the key resistance of $109, which corresponds to retracing of around 61.8%. Last time this was rejected, which was followed by a mini-down trend, until it found the support around $95. Next week will be the key. If unable to break the resistance, we will find ourselves re-testing the near term support at $100, then at $95. Of note. MACD is showing bullish divergence, hopefully, a breakout will follow. Good luck.

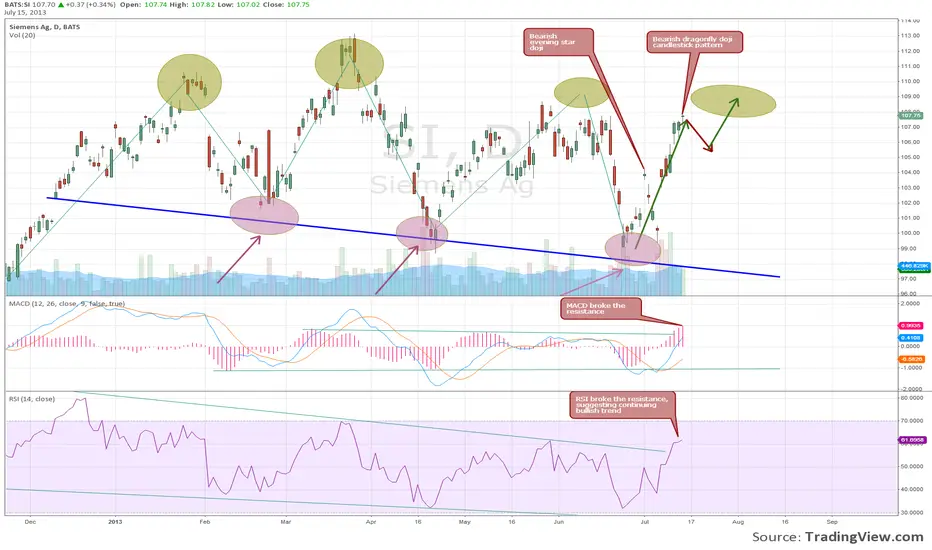
SI 7/15Moving along what we have been watching and expecting. Note the bearish evening star DOJI, followed by 4 days of brief downtrend last week. The uptrend continued shortly thereafter. Now, we are at $107.7. The candlestick pattern looks like dragonfly doji, which could be bearish. If bearish, this is expected to be short term, lasting a couple days or so. The MACD and RSI both broke the resistance line, suggesting that the bullish trend will continue. Stay tuned.
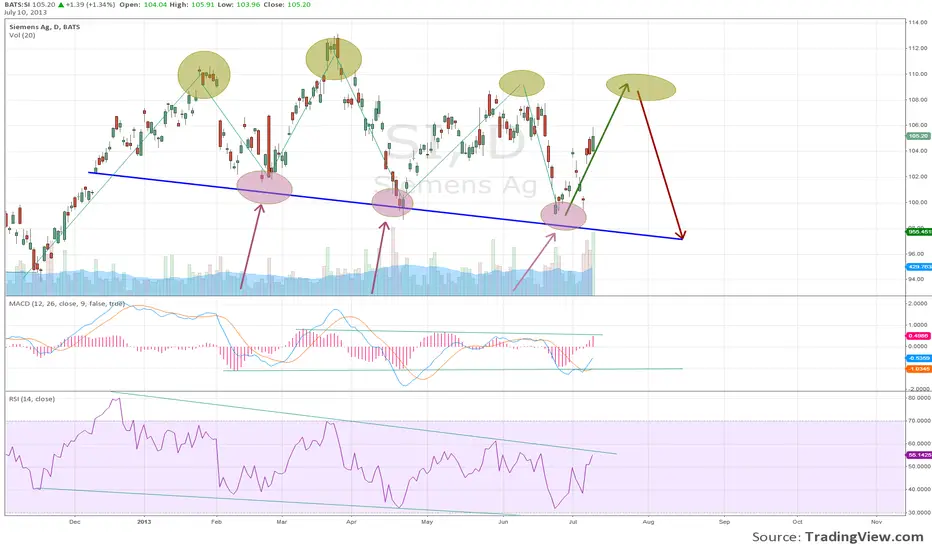
SI 7/10This is an update on the chart that was published previously. As observed, there is a very strong support line that is labelled in blue, which has been hold up so far. This is supported by the MACD and RSI, and have not been broken thus far, since Dec of 2013. I expect the stock to continue to trend up to the 106-110 area, and possible pull back to the support line.
SI 6/25/2013SI has establish a strong support line and has been bouncing off this support line 3 times for the past 6 months. While RSI and support line are down-trending down, I do expect, in the short term, the stock price to go up, but the peak will likely be lower than the previous highs.
