Long Champion HomesThis is a trend channel of Champion Homes ( NYSE:SKY ). Its a trend channel and lower channel line because of a breakdown.
SKY trade ideas

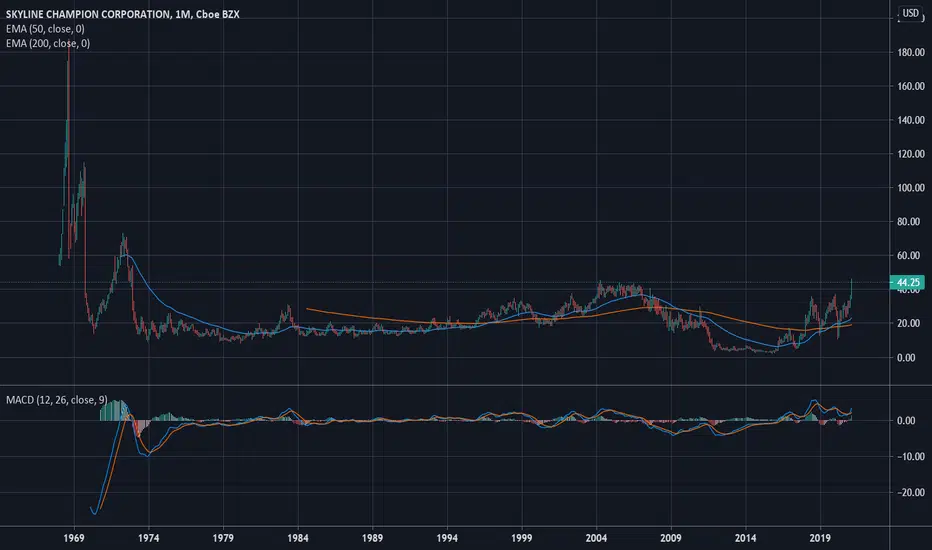
$SKY Strong Bullish Momentum and Growth PotentialStock Analysis: Strong Bullish Momentum and Growth Potential
Technical Analysis
The stock is exhibiting strong bullish momentum, supported by a notable increase in trading volume. High volume often serves as a confirmation of investor confidence and can signal the beginning of a sustained upward trend. Key technical indicators suggest a potential breakout, with price action aligning with bullish patterns.
Fundamental Analysis
From a fundamental standpoint, the stock presents strong growth prospects, with expectations of an increase exceeding 20%. This optimistic outlook is backed by robust market dynamics and sector performance, further reinforcing the investment potential.
Conclusion
The combination of high volume, bullish technical patterns, and solid growth expectations positions this stock as a compelling opportunity. Investors should keep it on their radar as it may offer significant upside potential in the near term.


$SKY Shorter Base Wedging Up $SKY with a shorter base (less than 2 months)
wedging up so looking for it to drift downwards a bit early next week to correct that pattern and puts in a better setup (orange bars)

$SKY Bull Flag SetupSkyline put in a bull flag setup after its 62% run breaking out on Friday. Ideal low risk entry would be on a pull back to flag support. I am watching a pullback to around $46 for an entry.
Skyline Champion Corp (SKY)- MANUFACTURES SINGLEAND MULTI-SECTION HOMES, MODULAR HOMES AND PARK MODELS.


Watching closely, long biasLong the sector in general, like the monthly close, no position currently
SKY Detailed video analysisWe have a chart request from Raimis12
This asset is looking like it had a nice run but with the recent weekly rejection candle it looks like we will now be correcting our 5 waves that we had to the upside. i don't see why it wouldn't be a good idea to take the long at the end of the retracement. the retracement could take us to 78 percent but it could pay off big time. the 5 elliot waves we got to the upside aren't pretty but they are there. that is to be expected coming off of a low as the bulls fight to take control.
i hope this video helped. if you guys want me to break this chart down further as new data comes in or if you have your own chart request please let me know.I'm always here to help.
take care guys and gals
rigo


Skyline Holdings headed to bottom of parallel channelSkyline Holdings has formed a new parallel channel, with long-term trendline support at its channel bottom. It's currently oscillating toward channel bottom, but with great analyst ratings and a recent earnings beat, we should see another upward oscillation after that. Buy long near the trendline.
As always, this is just an idea about how the market will move, not investment advice.

<TradeVSA> Beginning of Mark-Up stage in SkylineStrength in the chart:
1. Accumulation with shakeout
2. Line Change with increasing volume
3. Narrow spread bar and decreasing volume
Send us your preference stock to review based on TradeVSA chart by comment at below.
Disclaimer
This information only serves as reference information and does not constitute a buy or sell call. Conduct your own research and assessment before deciding to buy or sell any stock

