SLB: Schlumberger updateIt seems SLB is at good valuation now, but a risk in dropping international revenue still need to be figured out.
if this can be solved, then SLB is good to go.
Disclaimer: This content is NOT a financial advise, it is for educational purpose only.
Next report date
—
Report period
—
EPS estimate
—
Revenue estimate
—
2.95 USD
4.46 B USD
36.31 B USD
1.50 B
About Schlumberger N.V.
Sector
Industry
CEO
Olivier Le Peuch
Website
Headquarters
Houston
Founded
1926
ISIN
AN8068571086
FIGI
BBG000BT41Q8
Schlumberger Ltd. engages in the provision of energy technology. It operates through the following business segments: Digital and Integration, Reservoir Performance, Well Construction, and Production Systems. The Digital and Integration segment involves the combination of digital solutions and data products with its Asset Performance Solutions. The Reservoir Performance segment consists of technologies and services for productivity and performance optimization. The Well Construction segment includes the full portfolio of products and services for well placement and performance, drilling, and wellbore assurance. The Production Systems segment focuses on the development of technologies and provides services to production and recovery from subsurface reservoirs to the surface, into pipelines, and to refineries. The company was founded by Conrad Schlumberger and Marcel Schlumberger in 1926 and is headquartered in Houston, TX.
Related stocks

Quick View: $SLB- Great consolidaiton on the daily with EMAs+Price ready to make THE Move.
- The hourly looks good with a perfect box

SLB Long Trade Setup!📈 🔥
Recovering from sharp drop — trendline breakout forming 📊
Entry: $33.82 ✅ | Stop: $33.39 🛑
Target: $35.29 🎯 — potential reversal in play 📶
#SLB #LongTrade #EnergyStocks #StockMarket #TechnicalAnalysis #TradingView

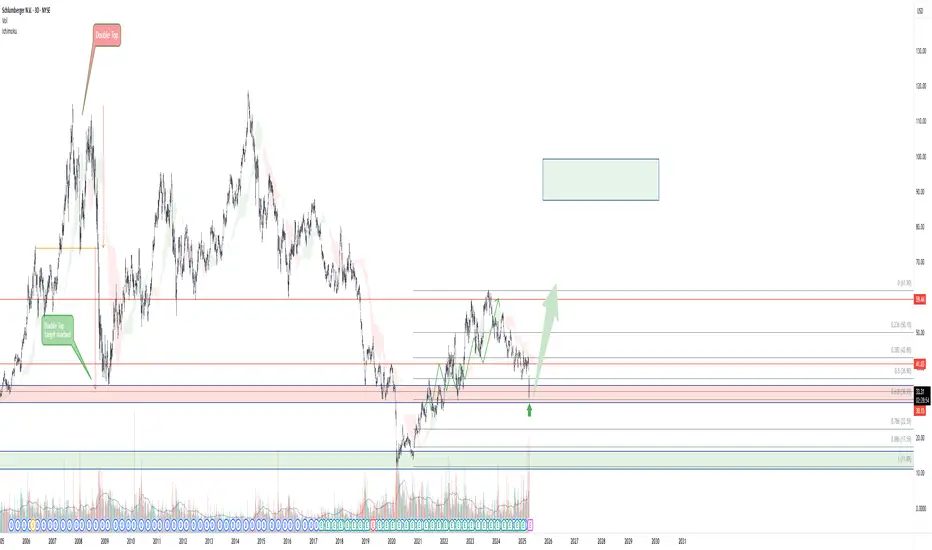
SLB could bounce SLB is still in a down trend but we could’ve found bottom. Tomorrow is earnings and it sure looks like a D1 breakout to the upside. If correct tomorrow’s earnings report hopefully will send us higher. Long term 1st target $74.41. (I may close my original investment here) I see oil reaching all time

Schlumberger Stock Chart Fibonacci Analysis 050925Trading Idea
1) Find a FIBO slingshot
2) Check FIBO 61.80% level
3) Entry Point > 33/61.80%
Chart time frame: D
A) 15 min(1W-3M)
B) 1 hr(3M-6M)
C) 4 hr(6M-1year)
D) 1 day(1-3years)
Stock progress: A
A) Keep rising over 61.80% resistance
B) 61.80% resistance
C) 61.80% support
D) Hit the bottom
E

SLB Schlumberger Limited Options Ahead of EarningsIf you haven`t sold SLB before the previous earnings:
Now analyzing the options chain and the chart patterns of SLB Schlumberger Limited prior to the earnings report this week,
I would consider purchasing the 27.50usd strike price Puts with
an expiration date of 2026-3-20,
for a premium of approx

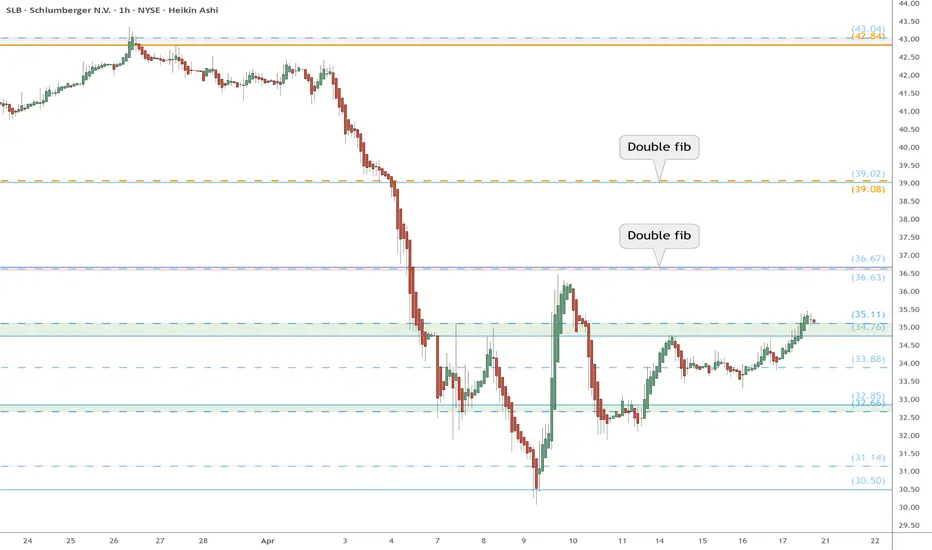
SLB watch $34.76-35.11: Key support to start/continue recovery SLB has crashed along with oil prices of course.
Sitting on a well proven support $34.76-35.11
Look for a launch into double fib targets above.
SLB: Bounce Loading or Basement Dive?After tagging my target around $60, SLB (Schlumberger) has been chillin’ in consolidation mode for a while now. We’re sitting on a solid support zone, and honestly, the odds of a bounce look better than a full-on dump here. Textbook vibes too—Fibo 0.618 lands right around $31, which lines up perfect
$SLBSLB looking to break out of this wedge after posting its largest volume day in atleast a year. Sheeeeeiddd

Schlumberger Has Been SlidingSchlumberger has been sliding for more than a year, and some traders may see further downside risk.
The first pattern on today’s chart is the series of higher lows between mid-December and early January. The oilfield-services company dipped below the line in late January and spent all of February b

See all ideas
Summarizing what the indicators are suggesting.
Neutral
SellBuy
Strong sellStrong buy
Strong sellSellNeutralBuyStrong buy
Neutral
SellBuy
Strong sellStrong buy
Strong sellSellNeutralBuyStrong buy
Neutral
SellBuy
Strong sellStrong buy
Strong sellSellNeutralBuyStrong buy
An aggregate view of professional's ratings.
Neutral
SellBuy
Strong sellStrong buy
Strong sellSellNeutralBuyStrong buy
Neutral
SellBuy
Strong sellStrong buy
Strong sellSellNeutralBuyStrong buy
Neutral
SellBuy
Strong sellStrong buy
Strong sellSellNeutralBuyStrong buy
Displays a symbol's price movements over previous years to identify recurring trends.
SLB4080519
Cameron International Corporation 5.125% 15-DEC-2043Yield to maturity
6.38%
Maturity date
Dec 15, 2043
US80685XAC5
SCHLUM.FI.CD 20/25Yield to maturity
5.90%
Maturity date
Sep 17, 2025
SLB3673764
Cameron International Corporation 7.0% 15-JUL-2038Yield to maturity
5.37%
Maturity date
Jul 15, 2038
USU8066LAE4
SCHLUMBERGER H.15/25 REGSYield to maturity
5.37%
Maturity date
Dec 21, 2025
SLB6056526
Schlumberger Holdings Corporation 4.85% 15-MAY-2033Yield to maturity
5.13%
Maturity date
May 15, 2033
SLB6039167
Schlumberger Holdings Corporation 5.0% 01-JUN-2034Yield to maturity
5.13%
Maturity date
Jun 1, 2034
SLB5816417
Schlumberger Investment SA 5.0% 01-JUN-2034Yield to maturity
5.04%
Maturity date
Jun 1, 2034
SLB5584893
Schlumberger Investment SA 4.85% 15-MAY-2033Yield to maturity
4.98%
Maturity date
May 15, 2033
SLB6054402
Schlumberger Holdings Corporation 2.65% 26-JUN-2030Yield to maturity
4.71%
Maturity date
Jun 26, 2030
US806854AJ4
SCHLUMB.INV. 20/30Yield to maturity
4.66%
Maturity date
Jun 26, 2030
USU8066LAF1
SCHLUMBERGER 19/29 REGSYield to maturity
4.46%
Maturity date
May 1, 2029
See all SLB bonds
Frequently Asked Questions
The current price of SLB is 35.63 USD — it has decreased by −1.03% in the past 24 hours. Watch Schlumberger N.V. stock price performance more closely on the chart.
Depending on the exchange, the stock ticker may vary. For instance, on NYSE exchange Schlumberger N.V. stocks are traded under the ticker SLB.
SLB stock has risen by 5.92% compared to the previous week, the month change is a 4.79% rise, over the last year Schlumberger N.V. has showed a −26.05% decrease.
We've gathered analysts' opinions on Schlumberger N.V. future price: according to them, SLB price has a max estimate of 63.00 USD and a min estimate of 36.00 USD. Watch SLB chart and read a more detailed Schlumberger N.V. stock forecast: see what analysts think of Schlumberger N.V. and suggest that you do with its stocks.
SLB stock is 2.26% volatile and has beta coefficient of 0.96. Track Schlumberger N.V. stock price on the chart and check out the list of the most volatile stocks — is Schlumberger N.V. there?
Today Schlumberger N.V. has the market capitalization of 53.48 B, it has increased by 4.14% over the last week.
Yes, you can track Schlumberger N.V. financials in yearly and quarterly reports right on TradingView.
Schlumberger N.V. is going to release the next earnings report on Oct 17, 2025. Keep track of upcoming events with our Earnings Calendar.
SLB earnings for the last quarter are 0.74 USD per share, whereas the estimation was 0.72 USD resulting in a 2.55% surprise. The estimated earnings for the next quarter are 0.67 USD per share. See more details about Schlumberger N.V. earnings.
Schlumberger N.V. revenue for the last quarter amounts to 8.55 B USD, despite the estimated figure of 8.50 B USD. In the next quarter, revenue is expected to reach 8.91 B USD.
SLB net income for the last quarter is 1.01 B USD, while the quarter before that showed 797.00 M USD of net income which accounts for 27.23% change. Track more Schlumberger N.V. financial stats to get the full picture.
Yes, SLB dividends are paid quarterly. The last dividend per share was 0.28 USD. As of today, Dividend Yield (TTM)% is 3.14%. Tracking Schlumberger N.V. dividends might help you take more informed decisions.
Schlumberger N.V. dividend yield was 2.87% in 2024, and payout ratio reached 35.41%. The year before the numbers were 1.92% and 34.33% correspondingly. See high-dividend stocks and find more opportunities for your portfolio.
As of Jul 30, 2025, the company has 110 K employees. See our rating of the largest employees — is Schlumberger N.V. on this list?
EBITDA measures a company's operating performance, its growth signifies an improvement in the efficiency of a company. Schlumberger N.V. EBITDA is 7.70 B USD, and current EBITDA margin is 23.14%. See more stats in Schlumberger N.V. financial statements.
Like other stocks, SLB shares are traded on stock exchanges, e.g. Nasdaq, Nyse, Euronext, and the easiest way to buy them is through an online stock broker. To do this, you need to open an account and follow a broker's procedures, then start trading. You can trade Schlumberger N.V. stock right from TradingView charts — choose your broker and connect to your account.
Investing in stocks requires a comprehensive research: you should carefully study all the available data, e.g. company's financials, related news, and its technical analysis. So Schlumberger N.V. technincal analysis shows the buy rating today, and its 1 week rating is neutral. Since market conditions are prone to changes, it's worth looking a bit further into the future — according to the 1 month rating Schlumberger N.V. stock shows the sell signal. See more of Schlumberger N.V. technicals for a more comprehensive analysis.
If you're still not sure, try looking for inspiration in our curated watchlists.
If you're still not sure, try looking for inspiration in our curated watchlists.