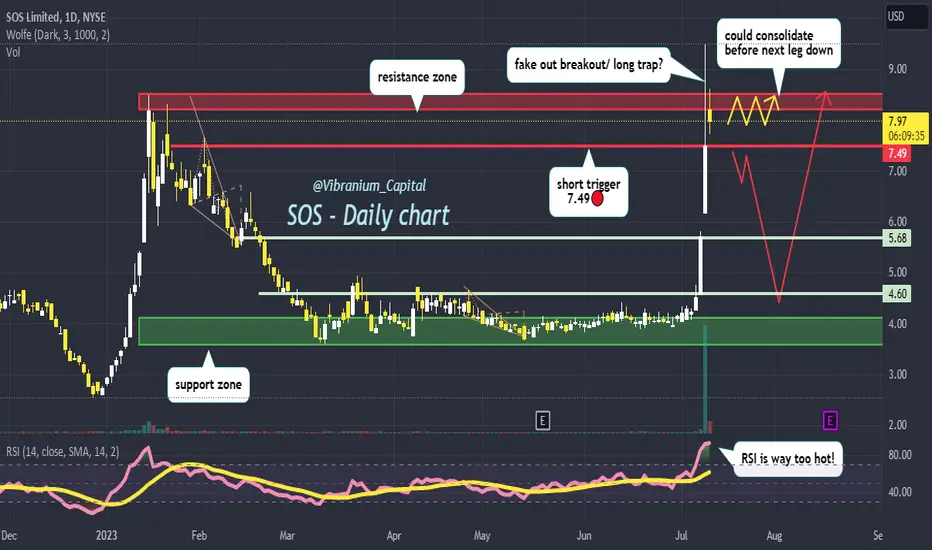
SOS setting up for a big drop? 🐻looks like a classic fake out breakout above resistance zone, break back below 7.49 and dip to 4.6-5.6 is possible before the next rally.. boost and for more! thanks 💛
SOS trade ideas
ADS w/Tiny Float Strong Momo. 20%, 100%, & 500% Targets Squeeze!$39M mkt cap Chinese Company, moved operations to US to mine bitcoin. It has 4 times the cash as the market cap due to several offerings to raise that cash to buy $100's of millions in Commodities and bitcoin miners. Has been slammed short by short seller reports. With bitcoin raging this is going to run quick. Was up 40% on Tuesday and short sellers slammed it back down Wednesday, so short interest is even higher. Could see more gains than $HKD here.

sos back to penny land?unless btc and eth breakout shes going down... the 50 ma coming like a tidal wave. my birthday is early march, may buy some sos at 2.00 or less. TAYOrisk


SOS long at 3.06SOS cryptocurrencies are moving, and SOS is lagged. It thus appears that a feasible breakup is in play. Target around 4

$SOS Bullish despite recent news SOS recently had an offering, so i get it if you are done with the company. However, when trading with technicals , it is best to avoid focusing on fundamentals and feelings about a certain stock. I see SOS currently in a huge buy zone around $.50. RSI is currently approaching a similar level when SOS ran last year. CM Williams VIX also indicates a change in buyer sentiment, which combined with a strong support zone, can help us determine when SOS may begin to reverse within this buy zone.
*Disclaimer - I do not own or trade BTC personally. I do trade BTC related stocks and alt-coins. This is only my opinion based on technicals I see.

SOS PREDICTIONSI believe that SOS in the short term is bearish and is bullish in the long term. Apologies for the messy chart, I created it on phone.


NFA - A Summary of $SOS's TA so far$SOS is in a Descending Channel
It need to be trading above 21 EMA to be Bullish.
Maybe with a good Form 20-F in May 2022
and US Mining Update PR's end of April 2022 to be Bullish again?

updated SOS analysis ✅last tim sos bottomed in 2020 it hit low of .51, this time around it was .56.. technically made a higher low bounce which is bullish.
as long as .56 holds we could head back to 3.51, but I would wait for trend resistance to break first as confirmation.
neutral at the moment, like and follow for more! 💘

Big breakout on #SOS bitcoin miner taking placeVery long slow decline and accumulation phase appears to be over and big volume coming in.

Potential reversal, but keep your eyes peeled Break over the daily 20ema with parabolics supporting price and its off to the races. 80c first target at the 4hr ema100. Then 85-90c at the daily 50ema.
With the market we're in, there is a lot of risk on the table. Don't fomo into things. Wait for clean breaks.
Your insurance in this market is being late.

SOS gearing up to gap fill Not a financial advisor.
SOS has been beaten down tremendously in the market.
It has been making progress with a reversal. Another thing to point out is that the company hasn't had any updates in quite some time. It may be a time to address the holders here soon.
Once SOS gains a little traction there is a gap to fill to $2.05 Which would get us above the 200 MA
RSI curling up
MACD cross bullish already
TSI crossing bullish to signal strength as well.
Likely the last time you see SOS under a $1 in Feb.

SOS short term target 1.50-2Although I'm a bear in the market on a macro scale. I do believe that we will see a Christmas rally in stocks as VIX is pointing oto $13 in January. You could probably throw a dart at the wall and buy a stock right now and make a quick buck for a 2 week hold. I choose SOS as it has a very nice wedge formation.
SOS Quick Updatehere is a quick analysis on SOS
a couple people have requested it so here it is. enjoy
Rigo

*a sleeping giant*in case you missed my clsk, any, sprt, ncty calls 👇
sos is moving their operations to the usa,
>bitcoin miner
>heavily shorted
>high demand by memers
>short squeeze pending.
--------------
my upside target is $35

SOS Limited (SOS) - Currently at entry for a long with good R/RGood risk/reward for an entry here measured to first PT. This is the most reasonable place for a bounce and a decent long entry IMO. I'm scaling in here with a stop loss in red as pictured. Trade at your own risk with your own due diligence.

SOSFalling wedge support, direct offers led to oversold, direct offer priced at 1.75 so $1.50 a bargain entry! Oh yeah, BTC ATH today!

Triple Bottom Touch Down for SOS- Time to Reverse?Chart Self-Explanatory- On the weekly, 3 time touch down on this trend line. Also, lines for a second large movement up as BTC continues it's bull run.

$SOS - Dead cat bounce or bottoming?SOS is sending out distress signal (S.O.S). The stock looks to be in bottoming process but still too early to tell.
You would want to see stabilization between $1.62 and $3. $1.62 is a strong support area. Breaking below $1.62 would be bearish.
If you zoom out the chart you can take Jan, Feb 2021 price action as dead cat bounce. Which looks quite bearish.
I would not touch the stock until sentiment changes as there are way better plays elsewhere.
———————————————————
How to read my charts?
- Matching color trend lines shows the pattern. Sometimes a chart can have multiple patterns. Each pattern will have matching color trend lines.
- The yellow horizontal lines shows support and resistance areas.
- Fib lines also shows support and resistance areas.
- The dotted white lines shows price projection for breakout or breakdown target.
Disclaimer: Do your own DD. Not an investment advice.

$sos secretly staying lowkey seems like its something to avoid. Tisk tisk, this Chinese stock has been heavily beaten down. sooooo shady but so many people tout this one.... What do you guys think?

Breakout!! Profit chance 450%!!!!
Good entry point and low risk. Place the stop loss 3% under the upward trend line.

SOS Break Out from Falling WedgeSOS closed above its' 20 and 50 day EMA while closing on a bullish 16% candle that broke out from a falling wedge. MACD and RSI currently confirming the bullish divergence that started taking place late May of this year.
