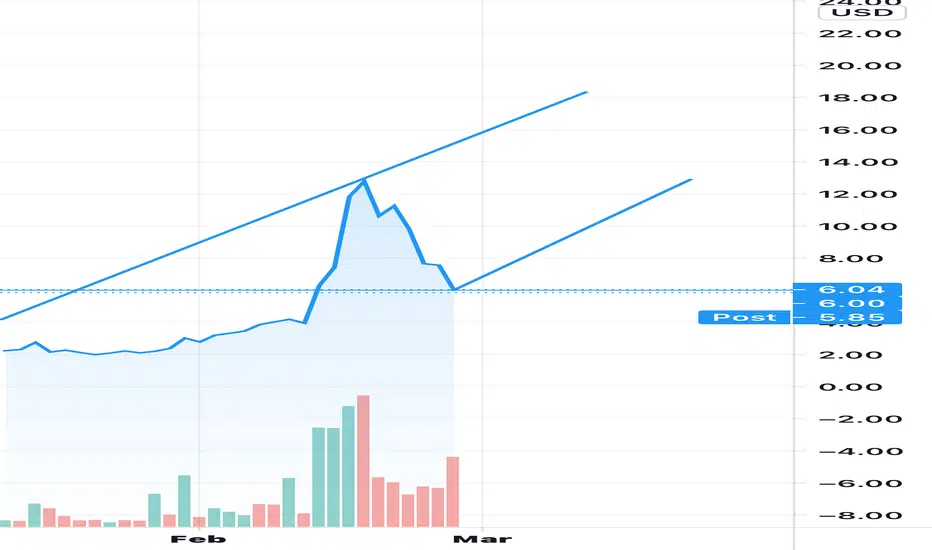
SOS Gap filled. Looking at SOS daily chart it is looking like it has filled the gap and is ready to go back up to previous highs. RSI is heading down, but im certain it is due to the overall red week we saw in the markets. Should be very interesting to see how this weeks plays out.
SOS trade ideas

SOS - sink or swimSOS at an area of value here. Mr wonderful has talked this stock up big. But I cant say I trust a talking (bald)head. Load up with stop loss right below support and you have a very low risk trade. Or go short with stop loss above...It can either breakout or breakdown from this point of support. I'm honestly leaning more towards breakdown....Please let me know your thoughts!
I will be waiting for a few pieces of information to come in before making a decision on long/short. Namely, consolidation on the MACD to break (preferably a nice angle >20degrees or so), move off area of support, and a solid trendline that needs to break. If it checks off these boxes I'm going long.
Theres potential for a massive move soon as SOS historically does..Wait for that buy signal!


Long | SOSNYSE:SOS
Possible Scenario: LONG
Evidence: Price Action
*Call options 19 March, Strike 20$
* This is my golden trade idea at the moment, I expect 100% return in different Tiers.
*This is my idea and could be wrong 100%, I'm not a professional advisor and I publish is just my personal ideas about price actions.

SOS Get Out Immediately!!Just as many other symbols are going up and completing blow off tops with evening stars, here is another one. SOS has went up about 400% within 4 day with a major gap and gap down to end the move with an evening star. The target is about $4.50, which is the 1.618 fib extension level of the first leg down and also the structure area of the break out. The move should be quick and swift.


Sos to $18I think SOS has been super oversold, most people panic cause they hopped on a bandwagon and don’t know how to play these!!!! With bitcoin plays is buy the dip or pay the price, I’ve traded Mara since it was a $1 and I see SOS moving the same!! My personal price target is $18-$26 .
Happy cashing
SOS - Retrace may be completeThe initial move up is very messy here as you can see in the chart. There's a lot of spotty price action making it difficult to get a great count, but what I can say is from the bottom in December 2020 to where we are today, I see a potential for a 5 wave structure on a smaller degree that has wave 4 nearing completion.
We are close to the 50% retracement on my measurement of wave 2 to wave 3. I'm willing to bet that we see a bounce from here. What I do not know is if this is the bounce that will take us to the target or if this is a dead cat bounce and we may find ourselves right back where we are today.
I'd be willing to take a play around here with a tight stop loss and maybe cutting part of the position near that gap fill at the 23.6% fib retracement level (around $9.69), and loading back up on that other potential pullback.
Here's the deal with this chart. Wave 2 took several days, and wave 4 usually takes a little bit longer than wave 2. In this case, I don't think we're done correcting yet, so this may be a suckers rally that we are going into. Careful for the fade.
Trade carefully friends!

SOS Swing Trade - Could move back up to $10SOS bottomed out here. Sold off heavily today and was one of the biggest losers today. There is a gap on the 15 minute that we may attempt to fill.

SOS !!!Well , after a pump there is a dump.
With company constantly diluting and cashing on hype investors loose .
SOS is is under short attack at the moment and bleeding will not stop for a while.
I think they want to bring it down to $4 , which Is possible.
I was long and took losses. I dont advise to trade it at the moment, very volatile.

SOS - 30min chart - bullish sharkHPC discovered a bullish shark pattern
buy in depth for
T1 11.20
T2 15.00
SL DAILY closing below 6.30

Massive short-squeeze incoming Extremely high short volume on this one recently, look for a breakout out of the flag, into a massive move!

SOS Bull Gang Lets go!!Nice rising wedge, gap fill to resistance continue the wedge before take off
It’s a China crypto company, the two biggest types of scams around, China financial accounting, and crypto, effectively guaranteed to moon before the crash
Let’s go bulls!!!

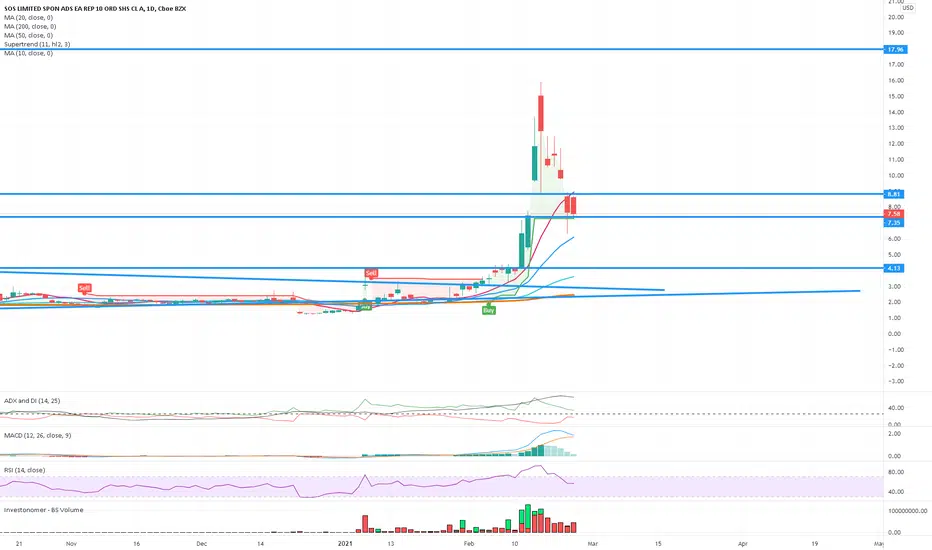
SOS be ready to 28my chart show at least 28, 16 and 25 are resistances, if we take SOS ATH at 130.
HOly SMOkes right?

SOS LongWilliams Alligator Indicator shows the lines ¨eating with an open mouth¨ (lips, teeth and jaw lines moving upwards and far away from each other), with the candlesticks above the lines, meaning SOS is in a strong uptrend.
RSI shows that SOS has recently experienced a correction, which might correlate with the red candlesticks forming recently. Currently, SOS is not overbought or oversold, therefore, a trend reversal is unlikely in the near future.
MACD line is over the signal line, indicating the presence of bullish momentum.
Candlestick Patterns: A Bullish Three White Soldiers pattern emerged 10 days ago, but a bearish pattern started 3 days ago. The pattern started with a bearish Hanging Man pattern, which usually emerges after an uptrend. Hanging Man confirms a trend reversal from bullish to bearish when the price moves lower on the next candle, which did occur.
Overview: Overall, all indicators suggest that SOS is in a bullish trend, but candlesticks suggest otherwise. SOS could currently be going through slight price correction or a complete trend reversal. A long position is recommended, entry price is set higher than current price for assurance, and stop loss is set at about -5%.


SOS: Bull pennant formed, PT = $16 this week, then up to 26.Resistance levels ~13$, given rising RS and current BTC hype, with volume this stock should pass that level 13 easily and break above the next resistance at ~16.50.
Intermediate term target (1-2months) = 26+. Stock has little resistance above that level, so with fundamentals / earnings confirmation from the company this is a solid 10x LONG play.

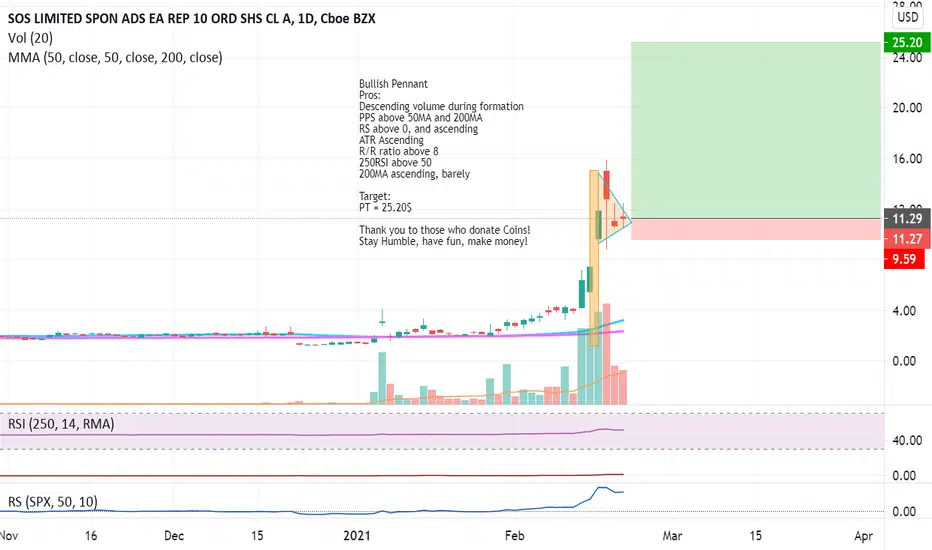
SOS: Bullish PennantBullish Pennant
Pros:
Descending volume during formation
PPS above 50MA and 200MA
RS above 0, and ascending
ATR Ascending
R/R ratio above 8
250RSI above 50
200MA ascending, barely
Target:
PT = 25.20$
Thank you to those who donate Coins!
Stay Humble, have fun, make money!
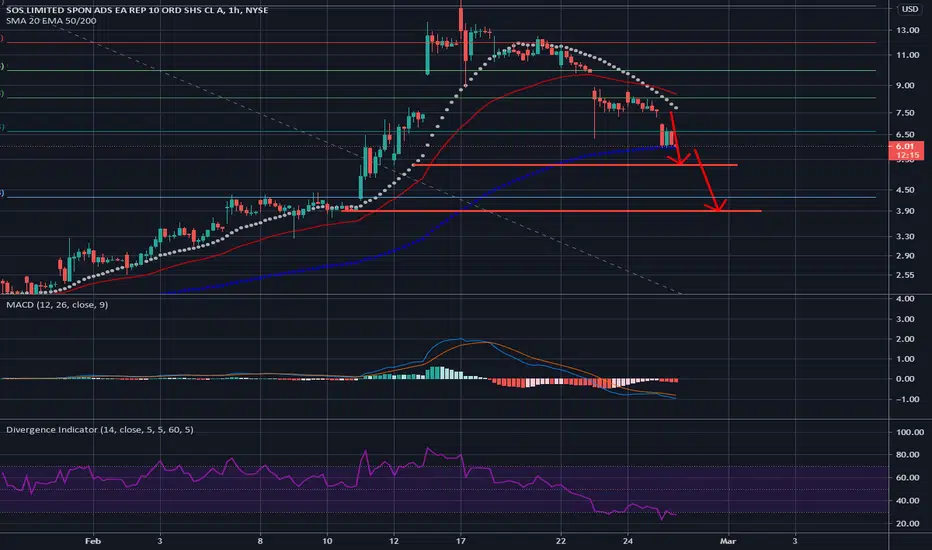
SOS-did you buy too high -what to do next ? SOS
So let's talk technicals :
The stock shot up 263% (red trend line) in 6 days. It did it in 2 waves of impulse.
The stock got massively dumped on the 17th of Feb – this is a big drop in a 2-hour time frame with over 50% retraced. Not a good behavior of an asset with a catalyst on it as it looks like a pump and dump which is not the case but traders took it as a flip!
Correction on the drop of 50% up from 10.5$ to 13$ -then stock lost traction several dojis in a row.
Guess what comes after several dojis in a row – a drop😊 that’s usually the case if you have an igniting bar followed by Dojis.
The stock touched below 10 – notice 10.5 is a KEY number on this trade!
Volume of entry is bigger than the volume of exit meaning the cycle is completed and now we wait to see where the second cycle takes us (opening volume vs closing volume)
RSI showing more room on the downside on 1H meaning on a 4H we are on the mid of the RSI level
What's the play?
Simple :
If the stock crosses 10.5 below and hits 9 this could be a convergence level where the stock will slowly travel downwards…. We must watch out for 10.5 level and 9 levels!
on the Other hand, if the stock bounces off the 10.5 to the 11.5 line and CROSSES it – we are good to go to the previous high at 16$ and potentially get a new higher high.
Notice accumulation is needed above 11.5 so we may get a side trend on that level before we go to the 16$
Volume Analysis :
3-month average: 23.5M
1-month average volume: 48M
Volume that drove the first wave up 70M
Volume that drove the price down 60M (good means we still have a lot of traders in on this one)
Current volume: appx 10M -keep an eye if crosses 30M we may get another wave up
FDGT will wait to see whats the stocks next move and if we get 11.5$ + we may jump in
Please do your own DD on the stock and trade safe!
We expect a correction on BTC soon that may correlate with the stock
Trade safe and be safe
FDGT the traders union

SOS weekly chart - final sell off done - volume and price actionimo after final sell off on the way to 10 and above... nive volume and price action
please be careful and good luck!

