SOS hold the $2.90-3.00 support? SOS is in a precarious situation. It needs to hold the $2.90-3.00 support line. If BTC dumps to 31K it might struggle to hold the $2.90 support area.
This may eventually pass, as eventually Crypto will recover in the long term.
Please Note: The analysis is based on my own views and it should not be treated as financial advice.
Please feel free to share your own opinions/comments.
Best,
Adit Doza
Part-time Faculty
Mike Ilitch School of Business
&
Final Year PhD Candidate (Expected July,2021), Department of Economics
Wayne State University
SOS trade ideas

$SOS making moves!@BullTrendz1 turned me onto this one. $SOS is making some moves and has yet to run into the resistance coming up. 18-34% gains in the short term, and if it pushes through there it has 90% gain until the next level of resistance.


The SOS Waiting GameEarnings are almost here but, big oof by Elon tweeting and bashing on BTC.
Good news is, SOS mines more ETH than BTC. And for a good reason too right; ETH is pretty much blockchain.
The biggest plus is that SOS is working to solve the fossil fuel energy consumption controversy/issue by reaching out for these deals with hydro electric companies. Something that RIOT and MARA have yet to act on.
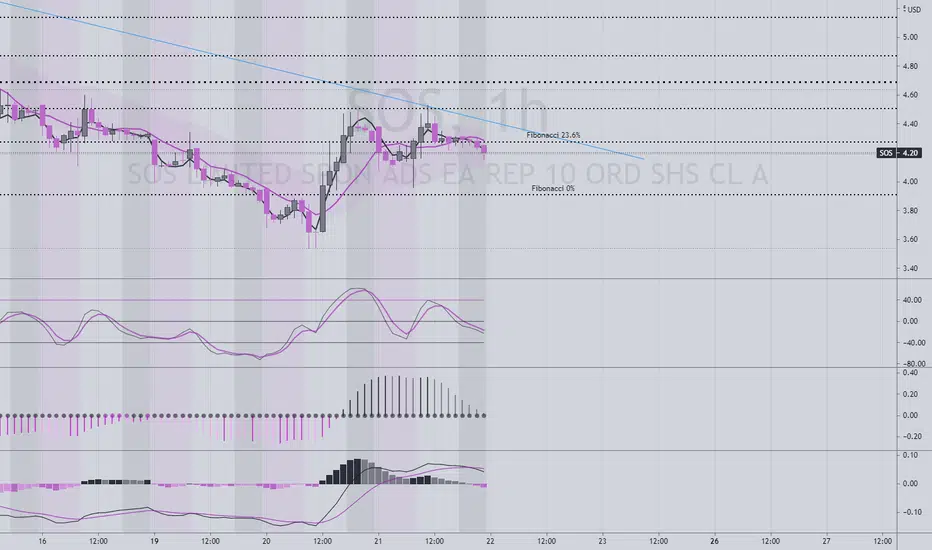
Technical analysis show that SOS has been following this downtrend continuation pattern. But, the MACD is showing an upwards trend. This is a sign of a classic divergence pattern (reversal pattern).
TA doesn't mean much due to the fact that blockchain investors react more to catalysts because there's very little fundamentals to work with. But the fundamentals are getting better for the blockchain ecosystem as a whole. I really like that SOS is using blockchain for real life uses. Even better, SOS subsidiaries obtained their MSB licenses from both the US and Canada -- a leap towards the launch of their digital asset exchange $$$.
I know that the hedge funds shorting this stock are watching these posts to plot against the investors. lol.
Safe investing everyone.


Avoid SOSNYSE:SOS
Please stop looking so closely in this stock.
I am asked about this stock every single day. It really boggles my mind to see bag holders disregarding price movement and imposing their assumptions on the market. That's how you lose this game.

SOS Long! both scenario are bullish in longSOS in two senario! both scenario are bullish in long.
Scenario 1: break 4.10$ and continue to upside'
scenario 2: pull back to 2.8$ and then a big buy pressure will take SOS up to higher high price.


SOS don't let the shorts flush you outTrust me, this is classic market manipulation. They have realized that people are actively trying to bust their shorts so they are increasing the pressure hoping that we do not have the patience to hold the line. Ethereum just hit an all-time high and SOS's mining operations (to my knowledge) are focused on ETH mining. Great way to diversify your (crypto) assets with a business that has a structure similar to Uber with a multi-faceted/multi-pronged approach versus the singular mining approach of others which would be more like Lyft. I say this because SOS has other operations outside of mining just like Uber has other operations outside of ride sharing.

SOS Update 5/9/2021 "DIVERGANCE"Hello, it's been a while. Due to all the crypto craze during all of April, now rolling into May and the summer time, I wanted to give SOS a chance react.
With SOS earnings in sight, it pleases me to know there's opportunity at such a low price. The 3 month trend as seen above is a classic example of a bullish divergence. A bullish divergence can be easily described as a technical indicator where the price-action of an asset makes lower low's during a downtrend, and the technical indicator I am using MACD is making higher low's despite the stock's price action + volume is decreasing therefore consolidating. This behavior represents support.
This is not guaranteed but when a divergence indicator is identified, there are good odds that we'll see a reversal. I'm just curious how much SOS has been making by mining Ethereum, that's all.
(((Trade and invest with caution, and practice risk management always)))
As always, I will continue to observe SOS daily. Follow for updates.


SOS signs of strengthSOS is a small cap financial services company in China that has gotten absolutely murdered over the last few years. Recently, it has been getting into blockchain services and showing several obvious signs of strength. It recently broke upward out of a long term exponential downtrend, and volume in the last month has been out of this world. Price targets are listed on the chart. Total time horizon is ~3 years, but it's possible that some of these targets could play out in the first few months. Let's see what happens.


SOSMID-TERM: Backtesting previous supply zone as demand zone with hidden bullish divergence. (not financial advice)

SOS Limited Multiple Wave Extensions-
Fib Lines .91/6.31/8.08/9.85
resistance- 4.53 4.99 5.51 5.89
support-Strong support at the 4.2121 level 3.90/3.78

SOS - Waiting for a big breakout on the weekly chart1. Look like SOS found its pattern as a big descending triangle. It's weekly timeframe so we have to give it sometime to move within that triangle until it's breaking out to the upside. up to 3 months to 6 months to hit 1000% (the pole of the flag) - Target $40
2. Neutral RSI - still around 50
3. MACD is still having some downside, but we should see it reverses soon as the blue line cross over the red line

SOS Pitchfork and Bollinger BandsSOS is still maintaining in the lower trendline. Bollinger bands are supporting the trend as well.
Hopefully the market lets the trend stay.

What's the next catalyst? Let's hope soon..A pop can happen any day now.. Institutions are buying, Bitcoin & ETH are rising, Earnings are coming.. SOS is undervalued, and needs to be trading along the side of his younger siblings MARA & RIOT. A large volume spike can send SOS to new ATH.


SOS | InformativeNYSE:SOS
* if it breaks the trendline, then it will fly. shorts will cover and volume will increase insanely.
SOS updateThe shorts appear to have sized up so this is looking riper than ever for a pop. www.marketbeat.com

