SASOL LTDLooking to be bullish with the bulls here beased on the diagonal resistance breakout which is currently giving a re-test and there is additionally the RSI Divergence to confirm this buy
SSL trade ideas


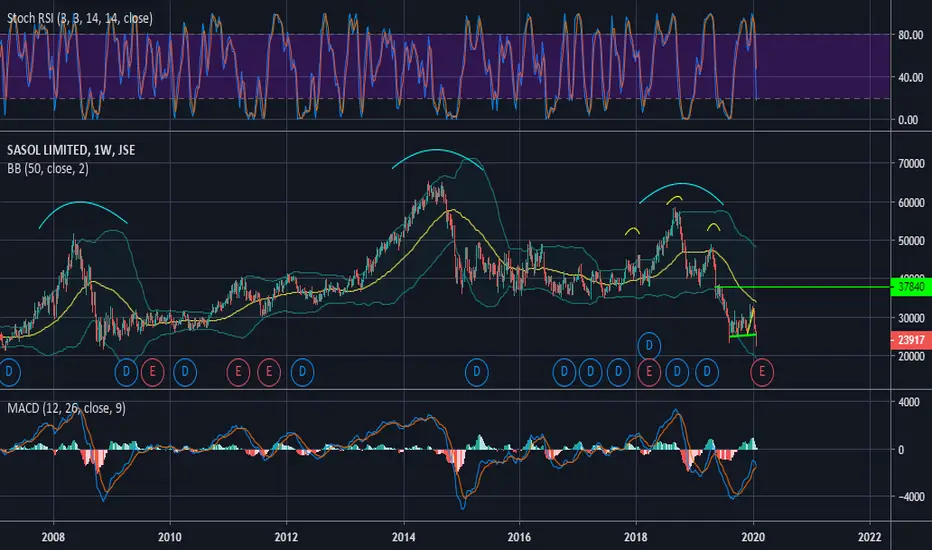
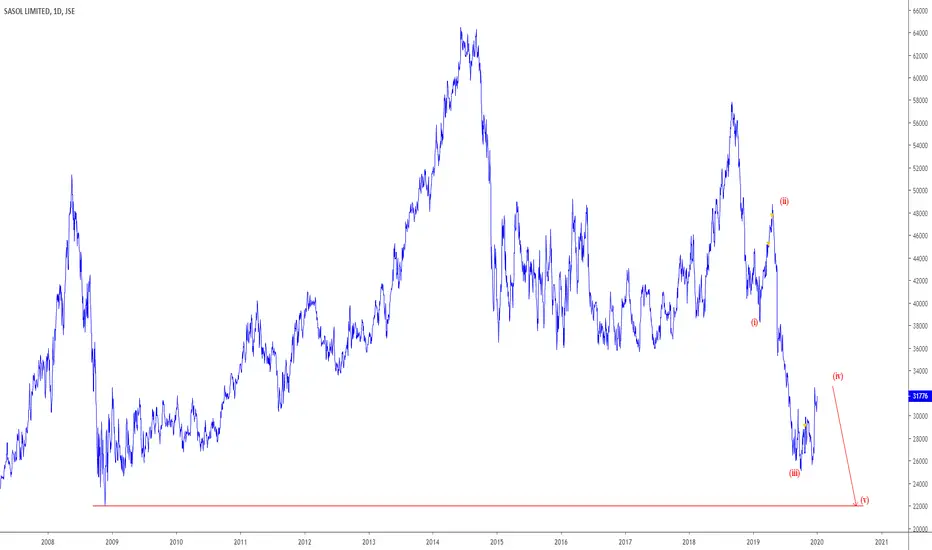
SASOL LTD5 Impulsive Waves completed bearish at the August 2019 low currently, I am looking for buy opportunities to pull us back up to close the gap.

SASOL Ltd is not looking good for now. I don't trade stocks but friend of mine asked me what is my input for this stock. Clearly to me this is going down to S2 zone and then potentially to S3 i.e. ZAR8000. Not sure about fundamentals of this company or the rest of the financial analysis, and I am not planing to short it. But if consolidates around ZAR8000 this could be good entry point for long term position as he was willing to do it.
Please do your analysis before taking financial decision and use SL or Hedging.

SOL still ShortSOL This has been a significant continuation of the H&S
movement we have seen this stock move down again
after my initial H&S and the continuation of that short
the lager Long term H&S is still in play hear
lock in profits or ride this third wave
keeping a tight stop loss
SASOL - Bottom of range - Sasol has been sold off quite agressively over the last couple of days
- Stochastics are oversold and we at the bottom of range
- Looking for longs
- Oil data out today
JSE:SOL
- MANAGE YOUR RISK -
Disclaimer: All ideas are my opinion and should not be taken as financial advice.

Flash Note: Sasol - At A Key Level (Short Term Idea)The price has retraced toward the prior breakout zone and has met up with:
- Horizontal support
- Incline Support
Some buying seen in the afternoon session, with the price on this chart being 26835c. After a few days of weakness (down from 320), it may be worth a look for a ultra short term rebound play.
Stop-Loss: below the support level ~ 26468c.

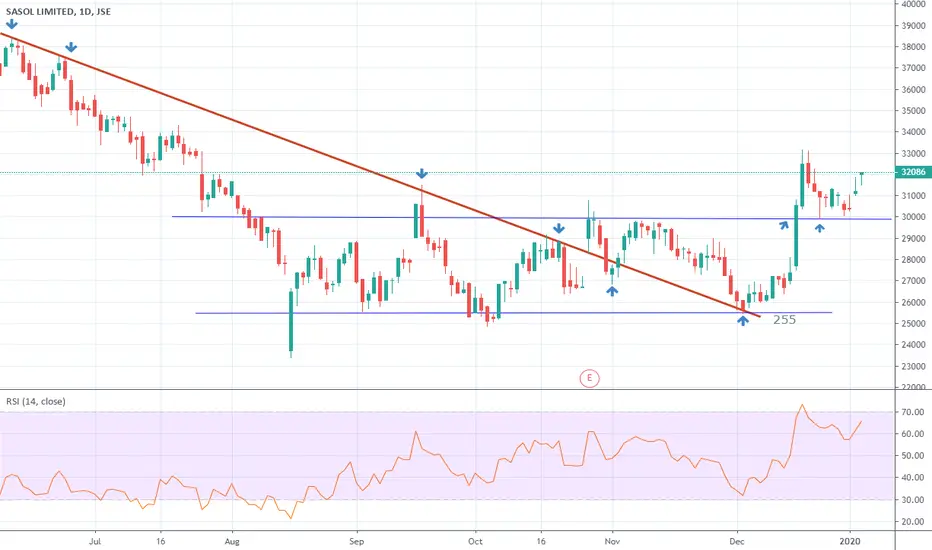
SASOL - Looking very bullish indeed- SASOL is breaking out of a bull flag and looks set to test the down sloping 200 ma
- The IRAN / US events are likely to continue pushing up the price of oil
JSE:SOL

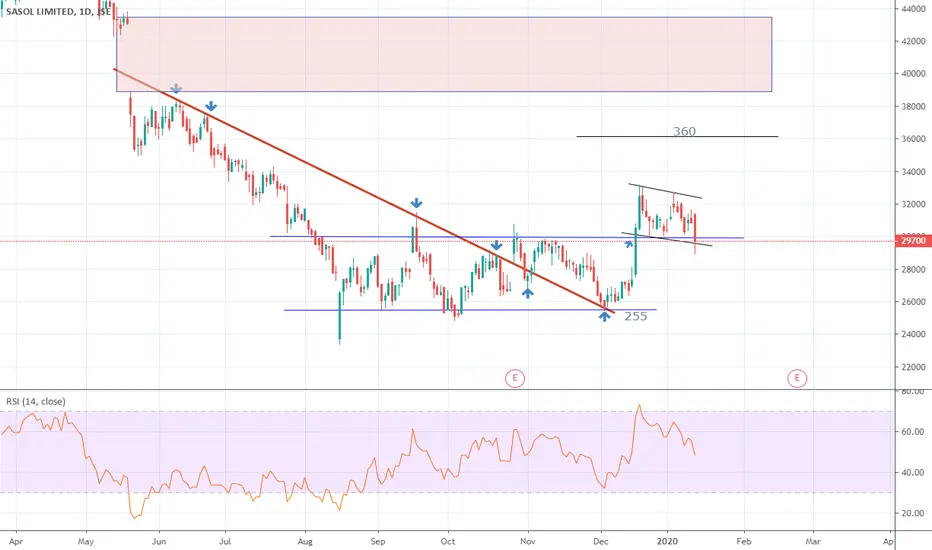
$JSESOL Sasol time to buy again?Sasol has come under sustained pressure over the last three days, after news broke out that they experienced an explosion at their LCCP facilities. The market is concerned surrounding the potential for further delays to this project as a result of the damages caused.
From a technical point of view, the counter is now retesting the breakout of the triangular bottom reversal pattern, and should we see Sasol manage to hold and reverse off current levels of approximately R282, i believe we could have the potential for a good risk-reward trade here to buy the stock. What gives me confidence in the triangle bottom pattern is the fact that the break-out on the 17th December to the upside occurred on significantly increased volume. The current level we are trading at the time of writing this, is not only a retest of the triangular pattern, but it is also where we find both the 89/100 day moving averages as well as the 61.8% fib retracement of the most recent swing highs and lows.
Keep an eye on action around current levels, as any sign of a reversal could well be an opportunity to buy the stock with a tight stop and a potential for the counter to push back to recent highs of R330. (The triangle bottom pattern still has a much higher target in place of R370 should this play out in a textbook fashion).

$JSESOL Bull flag in the making ? Sasol looks like it's building a bull flag. Still early days, but will keep an eye open for a break in coming days.
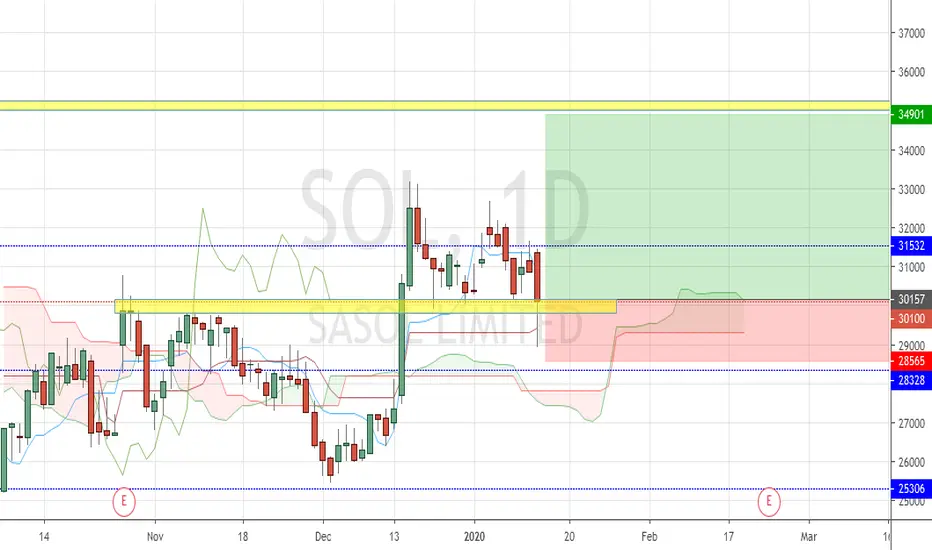
Add to an old tradeGood place to add to our trade. Remember we have an open trade on SOL since October. We open this on the back of that yellow zone which has been successfully defended since December. So we expect whoever is fighting this battle to take us to our Take Profit at the 35 000 zone. Very good RR as well.
Entry: 30 100
SL: 28 565
TP: 34 900
I cant overemphasise appropriate risk management!
JSE:SOL Sasol Pullback in DowntrendSasol has been week and recently broke out of a long term trading range (TR). However, more recently an accumulation TR has formed that could take us back to test the long term TR. We have backed up (BU) to the accumulation TR and I am now looking for a break higher back to the longer term TR.

$JSESOL Sasol channel break and retest. BullishAfter a recent channel breakout on some positive Lake Charles production numbers the channel support line was successfully retested and held. This is a positive bullish sign. Longer term buy.
Take Profit-FinallyAfter almost 2 months waiting and getting stopped out once and reentering , sasol finally comes around and hits our 1st take profit. Now we wait for the 2nd TP at 35 000.

Long term value unlockSOL seems to have bottomed and continues to consolidate under R300 progressively posting higher lows. Should the Lake Charles project finally become earnings accretive, there seems to be some value to unlock longer term. Such a positive catalyst could see us retest a previously well established support line (Suspect will be strong resistance)

$JSE-SOLJSE:SOL
Breaking sideways consolidation after very strong day yesterday and strong open today.
First target is around 38000 above that gap close.
Ideally one should wait for pullback but not sure if it will happen.

SASOL - Running out of fuel...- Looking to see what price does at R250 level for and entry as i suspected a consildation will develop which can be traded (range)
- Failure to hold that level will open up new downside risk
- MANAGE YOUR RISK -
Disclaimer: All ideas are my opinion and should not be taken as financial advice.
JSE:SOL

$JSESOL Sasol Target reachedUpside 29700 target reached. Will keep an eye open for a 29700 breach and how the buyers react.


$JSESOL Sasol. Consolidating within a defined channelSasol currently traded in a defined 255-297 channel. Consolidation usually leads to a move higher or lower. Immediate downtrend seems to have been broken and tested. Buy with a target of 297. Sell with a daily close below 250.
