AG Capital -Storm trading Morning Call 23 February 2022We give a quick recap of markets overnight and the previous day and insights into the day ahead with a few trade ideas on the day. Ideas are strictly NOT INVESTMENT ADVICE.
SSL trade ideas

SOL LIVE NOWSolana (SOL) has become a major platform in the crypto space, after going live in early 2020. The high-speed, high-throughput, proof of stake chain is well-known for its fast transactions, scalability, and affordable fees (and also its recent performance/technical issues which have also been quite serious).
The Solana DeFi, NFT & Metaverse ecosystem has been growing steadily since launch – attracting both end-users and application developers.
At Dune, they believe that the future is multi-chain. They also think that a multi-chain future requires robust multi-chain analytics to succeed. It’s their goal to make crypto data accessible and transparent, and to “empower anybody to become a skilled on-chain analyst.”

Sasol LimitedSasol has had an incredible run over the last year and has been in a clear uptrend, higher lows and higher highs each time.
There are no signs of this abating, although fundamentals should be considered.
I believe that if the oil price stays elevated, sentiment will continue to drive this share higher where it could close the gap from May 2019, closing that gap back up to R425
If this is the case, then we can expect an additional 30% upside from current levels.
I will start nibbling at current levels and will accumulate dips.
My new exit price will be R425 ( 29% upside)
My stop loss price will be at R250 ( 24% downside)
This is just looking at the technical side of things and is not taking the fundamentals into account. We mustn't forget that Sasol hedged their oil price last year, as well as the USD/ZAR exchange rate, so higher oil prices doesn't necessarily equate to bigger profits. This means that at some point the price will reflect the fundamentals, but at the moment I believe it is sentiment driven and will continue to be as long as we have these dark clouds surrounding Russia and Ukraine and the price of oil.

SASOL going downJSE:SOL is showing signs of downward momentum and is looking good for a short position.

AG Capital -Storm trading Morning Call 16 February 2022We give a quick recap of markets overnight and the previous day and insights into the day ahead with a few trade ideas on the day. Ideas are strictly NOT INVESTMENT ADVICE.

SOL volatility spikeSOL
false breakout or not goes both applies for both directions
will have to wait and see

SOL Top Formation Reduce riskSOL on the 4th Feb i reduced my risk and took 50% of my profits
i called a short term top to SaSol it seems my timing was good
and the correction i anticipated is in progress.
i could be wrong but for now i seem to be on track.
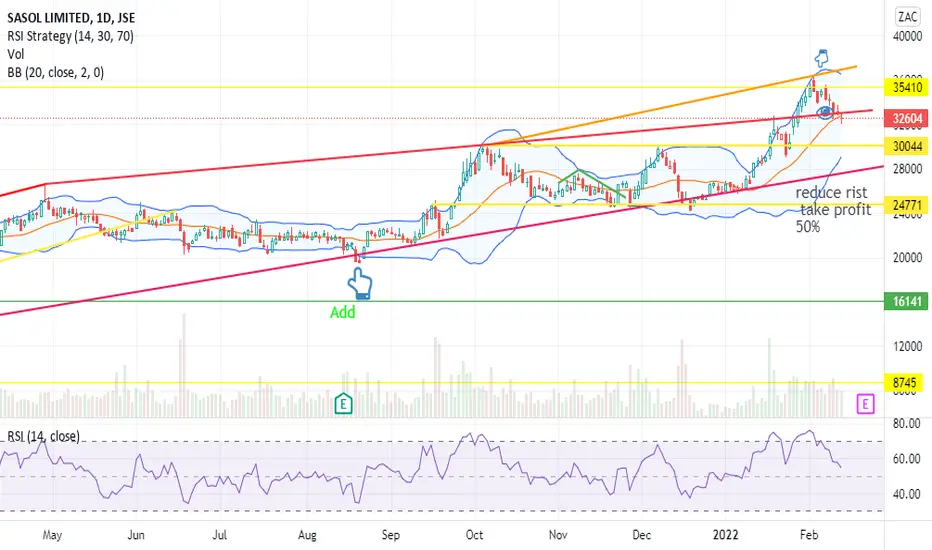
SOL Take profit 50%SOL since first recommending SOL at R33.24
in 2020 the stock has had a stellar performance
with oil helping to set new highs i would take some profit off the table
as a market crash could wipe out 80 % of the profits made so far.
only time will tell how far this melt up in asset prices will last
before we have a correction. but i am on the fence for now with
multiple stop losses just in case the market prediction pans out.
increase your asset purchase in Gold as a hedge

SOL (D)SOL is currently on an upward trajectory supported by the Higher Oil price.
It has reached the first target at 35900 and could be heading towards the second target of 47900
If Russia invades the Ukraine( which looks increasingly inevitable) Oil price could move significantly higher which would support SOL .

SASOLsasol an incredible bounce back from the march 23 low of 2020 we might see sasol coming and going as high as its all time high

Sasol going higher high. SOLHigher highs on the daily, crashing through a resistance. We are highly likely going up on this one.
We are not in the business of getting every prediction right, no one ever does and that is not the aim of the game. The Fibonacci targets are highlighted in green with invalidation in red. Fibonacci goals, it is prudent to suggest, are nothing more than mere fractally evident and therefore statistically likely levels that the market will go to. Having said that, the market will always do what it wants and always has a mind of its own. Therefore, none of this is financial advice, so do your own research and rely only on your own analysis. Trading is a true one man sport. Good luck out there and stay safe!

@VIllageTraderZA Sasol back above R300 for the first since 2020The stock broke the R300 level for the first since Jan 2020.
I raised my stop loss to R274.20 securing +0.37% profit.
I will add 1% risk to the trade

SOL (D)SOL is going through a short period of consolidation.
It is still keeping above the pink trendline and looks to be moving up to the orange line which is potentially the neckline of an INVERSE HEAD AND SHOULDERS formation from July 2019.Should it breakout above the orange line it could be heading towards the black horizontal line.
SOL however needs to remain above the horizontal blue line or else a double top formation could be confirmed ( BEARISH)

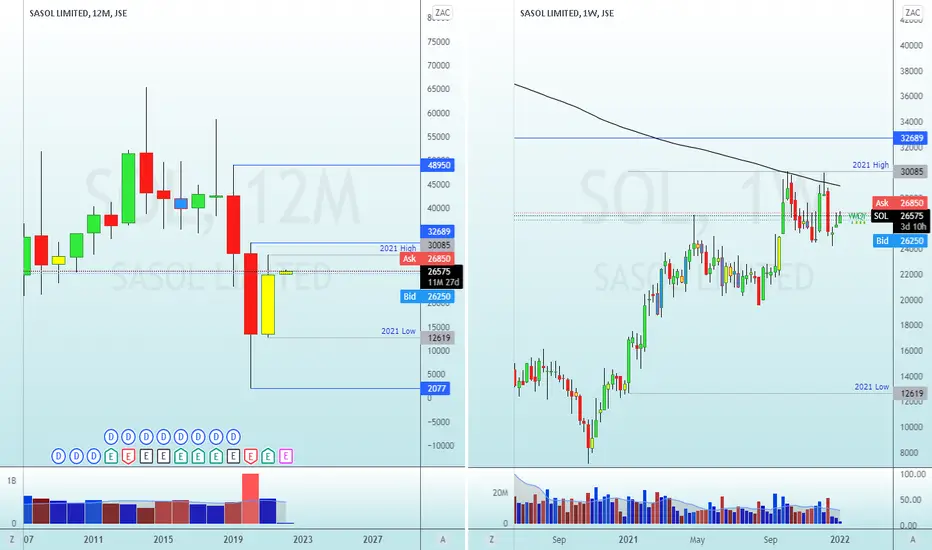
SASOL - Yearly Inside Bar ideaSasol formed an inside bar / range in 2021 R300.85 - R126.19
Bullish case will be a break of the high to trade towards R489.50
Early entries and risk management can be done on the smaller Monthly/Weekly/Daily charts
-- MANAGE YOUR RISK - -
Disclaimer: All ideas are my opinion and should not be taken as financial advice.

AG Capital -Storm trading Morning Call 14 December 2021We give a quick recap of markets overnight and the previous day and insights into the day ahead with a few trade ideas on the day. Ideas are strictly NOT INVESTMENT ADVICE.

SASOL (SOL) (D)Sasol is potentially working on an Inverted Head and Shoulders Formation , potential target could be the Black longterm Support/Resistance Line at R358,97
Major contributing factors will be the Oil price and the USDZAR.

SasolStill bullish above 244, a break below this price will see decline to below 150.
Oil is heading to below $50, only thing keeping this stock bullish is the decline in the ZAR.
Should USD roll-over which we dont expect, USD is in correction for more upside, We are looking at 99 + on the DXY.
We have very low growth forecast for 2022, Foreign direct investments into SA to decline substantially over the next business cycle, I still believe we will be hit very hard with inflation, the Eurozone will be hardest hit by all Developed countries, Sit tight 2022 is going to be one to remember.
We are in the last month of the year, its time to reduce risk on your portfolio and start looking at defensive options to protects against a surge in inflation locally.
China PMI numbers anf forecast is looking bleak, Australia to suffer the most, We favor XXXJPY shorts for the remainder of the year

Down move on SASOLJSE:SOL has broken out of a triangle pattern, signaling a short position. If it continues down, I think we could see a move towards the 22500 support region.

AG Capital -Storm trading Morning Call 4 NovemberWe give a quick recap of markets overnight and the previous day and insights into the day ahead with a few trade ideas on the day. Ideas are strictly NOT INVESTMENT ADVICE.

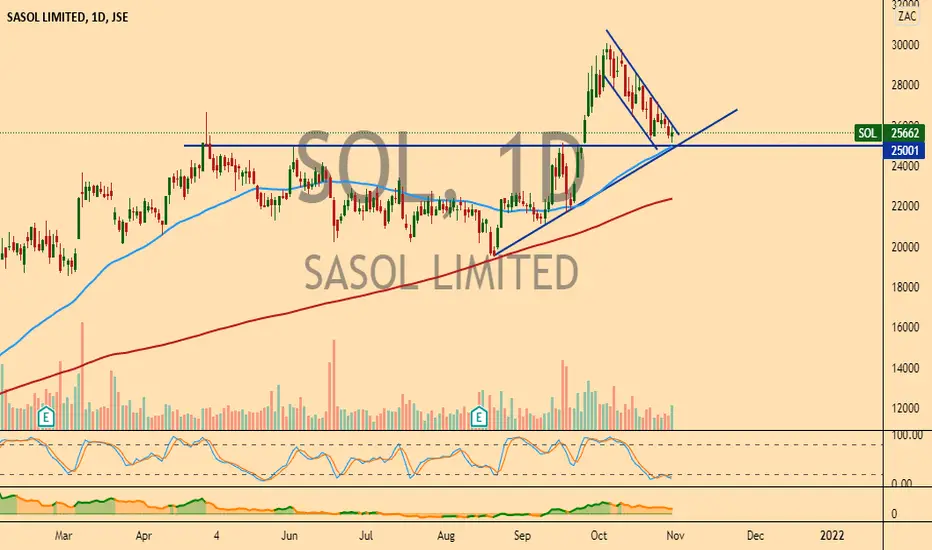
SOL bull flagAfter a solid run in September SOL is pulling back to the 50DMA in the form of a bull flag. If the flag triggers i will be looking for R290 and then R300 as possible targets.
Trade ideas are my own and not financial advice.
SOL to charge again?Hi Guys
You can see we reached a support restistance around 26700, reached at the end of April '21 as well.
With the RSI not oversold but lower than it's been in 2 months and buying activity at higher prices, I think the price will go up towards 27600 - 28000 again.
What are your thoughts?

QuestionIs it advisable to wait more for the market to drop or will it not have a big impact in the long term investment.
