SOL: repetitive price action?The price action remains in a declining channel pattern.
However, the price action seems to be in a repetitive price action swinging between the low and the high of this declining channel pattern.
RSI leaves enough room for further upside price potential.
Wait for upside price momentum to support the price action.
RSI leaves enough room for such a bullish bias.
Setup remains risky.
SSL trade ideas

SASOL
>SASOL and the oil industry have recovered from the 2020 March oil crash
>Buyers of the March had massive gains and now by the looks have taken profits
>Selling off has begun with targets +R140
>130 to 157 Zar looks like a good zone where new buyers will come in

SASOL >SASOL and the oil industry have recovered from 2020 March oil crash
>Buyers of the March had massive gains and now by the looks have taken profits
>Selling off has begun with targets +R140
>140 to 157 Zar looks like a good zone where new buyers will come in

JSE:SOL Sasol Markdown Set to Gain MomentumAfter following the markup in 2020 - see posts below - we have seen a distribution trading range in our previous post. Now this markdown is set to gain momentum with high volume selling taking place. Today's reversal bar confirms the basis.

SOL H&SSOL formed a H&S pattern which already triggered. I am not prepared to short SOL but if this pattern plays out it can target R190. I will rather monitor for a pattern around that level to go long.
Trade ideas are my own and not financial advice.

JSE:SOL Sasol Time to Let it GoWe have been following Sasol sins the climax lows in 2020 indicating a target of R200 - see the progression of posts below. We have reached the target and now we are seeing active signs of distribution. After a climax in March, there was a strong secondary test but the next upthrust (UT) on volume made no progress (Effort without Response) indicating selling by the big players. A change in character was seen in June with an increased downward spread on volume making signs of weakness (SOW). The latest attempt to rally could not break the 50SMA and after a key reversal bar, it is time for Sasol to drop potentially retracing all the gains of the last year.

Sasol Ltd breaking out of the channel.The stock looks set to break out of the channel and head for previous highs. The high inflation seems to bear no effect of the South African stocks. Expect the stock to reach profit levels 24087.

Sasol looking like a good shortLooking for a hourly close below 20800 to get short, and should have a daily close below 20800 as well.
Possible downside targets are 18500 and 16500.
There remains a open gap on the daily chart at around 15100 as well.

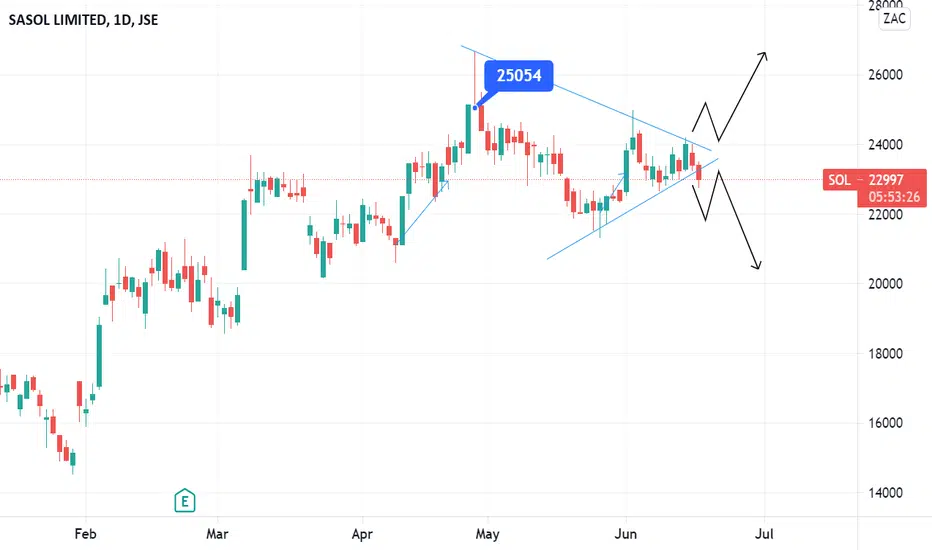
Sasol...which way?Hi guys, it's been a while! I meant to post this on Tuesday two days ago
So we see SOL making lower highs and higher lows in this triangle pattern.
I think we can wait for the breakout and retest and then trade in that direction.
Note I don't short because of fees on the platforms. But today looks like it might break lower. Wait for candle close.
Also note the rejection of R250 with the long wick.
What's your thoughts on SOL?
SASOLPositive look out there for sasol as it is in the stage of recovering in terms of the share price....More bullish movement to come and this might mean more opportunities for Buy seups

SOL ShortSOL bouncing on Resistance
Possible pull back due to market correction
Before any further uptrend

SOL - Potential Bull flagSOL is showing some signs of support at R220 making 2 bullish pin bars in a row but struggling to close above R225. Should it manage to do that and move above R228 the long idea is on with 1st target at R240 and full target at R260. A close below R215 is the stop loss.

SASOL Limited Daily Timeframe AnalysisNot sure what the market is doing right now, but if I had some shares, I would hold.

SOL - Consolidating SOL seems to be consolidating after a trading update which touched a high of R266. Currently holding R233 while a close above R246 triggers the long idea with R265 as target and a further move towards R280 is possible as well.

Clinging to the upward channelSasol still hanging in there, needs to get moving or I'd be worried about a drop out of the channel

One more push? SASOLSasol trying really hard to test the next upper resistance. Yesterday's early spike to 142.00 may skew the last candle a bit but the chart suggests that 150.00 might still be on the cards

SASOL - Upward Channel HoldingJSE:SOL has been trading in an upward parallel channel since October 2020.It has made numerous unsuccessful attempts to break out of the trend since then but the upward channel has held. With the break of the previous highs last week, I think we can continue to see an upward rise in the price all the way to the resistance level at around 28000


Sasol Analysis As predicted Sasol took a bit of a breather possibly due to the slowing oil prices as well.
If we are going by the pattern(which is what we used for the prediction on the last analysis) its only a matter of time before the share price pops. Positively hopefully. Vaccine roll out is looking very good in popular first world countries and this could expedite the global economy returning to normal and thus increase demand for oil, driving up the oil price and in-turn increasing Sasols share price. Currently we are in a decent point to buy in. Chances are as the global economy returns we could see a positive impact in the energy sector.


SASOL - Short if trend is brokenJSE:SOL is showing all the signs of a direction change based off of the stochastic, MACD and EMA's. I will however, only enter short if it breaks and confirms below the trend line that it has been adhering to since the end of October last year. Once this is confirmed, I think we could see a nice downward move for a while.
