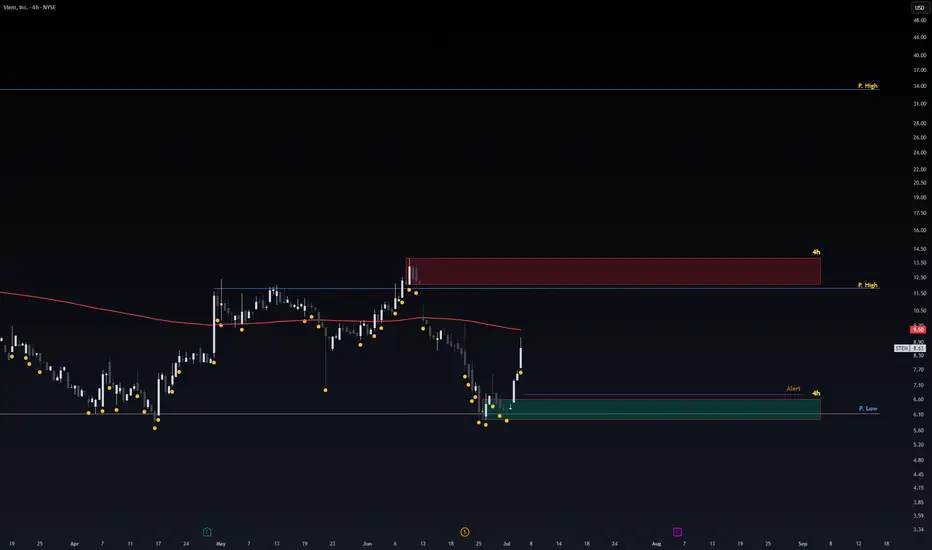
Safe Entry STEMPrice movement consolidating.
Safe Entry Green Zone.
Red Zone is Sell Zone. better watch out for any selling pressure.
P.high Lines Are Good Resitances.
Final Target 33.45$ price level.
better to wait stock and not follow.
Note: 1- Potentional of Strong Buying Zone:
We have two scenarios must
Next report date
—
Report period
—
EPS estimate
—
Revenue estimate
—
−99.39 USD
−854.01 M USD
144.58 M USD
7.74 M
About Stem, Inc.
Sector
Industry
CEO
Arun Narayanan
Website
Headquarters
Houston
Founded
2009
FIGI
BBG00XP8NQN4
Stem, Inc. engages in the provision of an energy storage system, hardware, ongoing software platform and professional services, and solar asset performance monitoring and control. The company was founded in 2009 and is headquartered in Houston, TX.
Related stocks
STEM reboundstrong rebound of STEM in area 6, only the holding of this level could project towards the 11-13 area

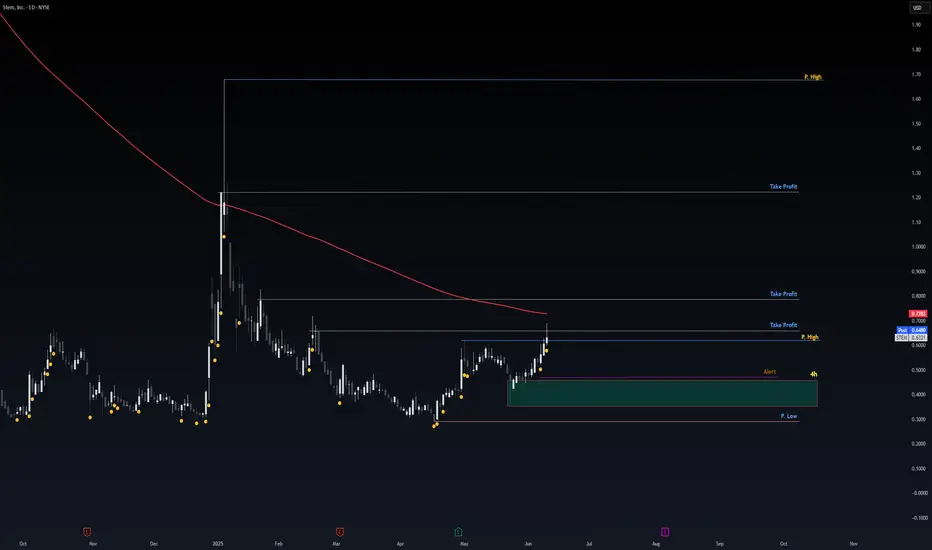
Just Crazy Thoughts of Crazy GainsStock showing Buying Power recent days.
Each Take Profit Line is where you may secure profit and run.
Re-testing the Green Zone 4H with Buyers Step-in is perfect.
Maybe we may not re-test it current price close at Support Level if it held for next session.
I believe we will see Gains of 500-1000
STEMFor STEM, the maintenance of the support in the 0.60
area is important, the breakout of the 0.82 level will
then be a significant signal for the resumption of the
positive trend, the loss of the 060 level is a signal that
could bring STEM back towards the lower support levels

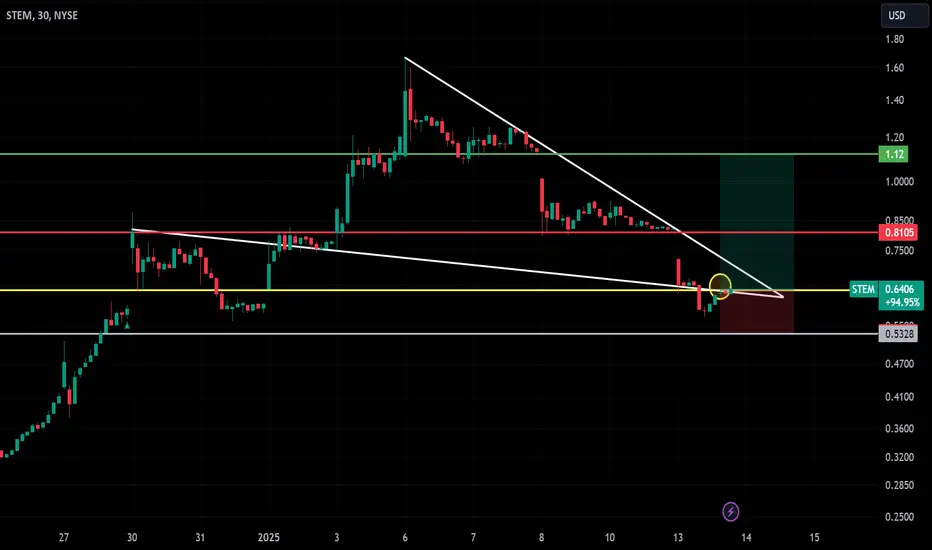
Filling the Gaps: Bullish Trade Setup !
💡Observations:
- Wedge breakout potential with gaps to fill! 🚀
🎯 **Plan**:
- **Entry**: $0.6283 📊.
- **Stop Loss (SL)**: $0.5328 🛑.
- **Target 1 (T1)**: $0.8105 🎯.
- **Target 2 (T2)**: $1.12 🚀.
⚡ A great risk-to-reward setup—watch for momentum! 🔍✨
@Tery021
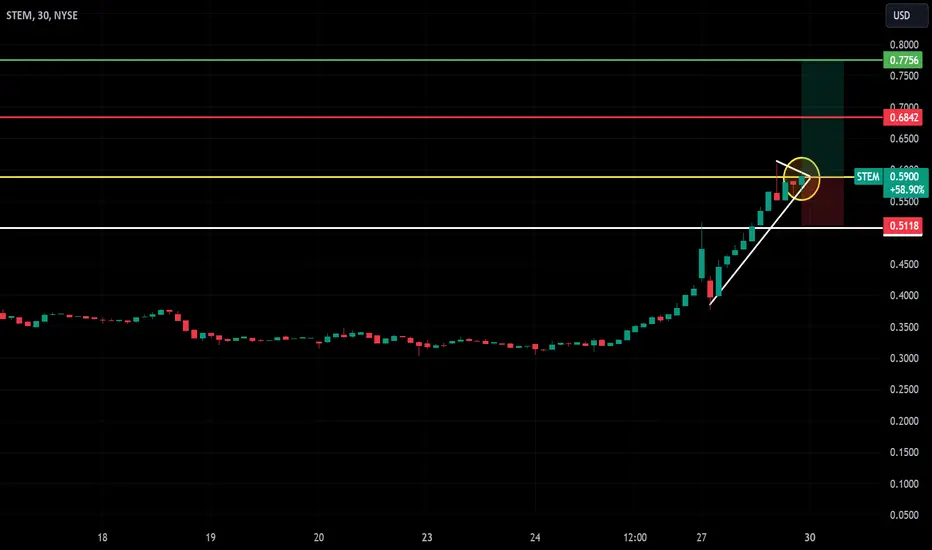
Momentum Breakout Trade on STEM!
Stop Loss (SL): Below 0.5118
Entry: Above 0.5900
Target 1 (T1): 0.6842
Target 2 (T2): 0.7756
Why Trade:
Breakout above resistance with strong volume and momentum.
Conclusion:
Defined risk-reward; monitor breakout sustainability for target achievement.
Pre-Earnings BreakoutNYSE:STEM
Looking at the downtrend line for STEM you will notice we have connected four touch points. Today the price action signaled a breakout above the trend line.
Second Image:
In the 'Second Image' we added the 50DMA and notice that yesterday 11Jul24 the stock closed above the 50DMA for

STEM Likely BottomFelt an urge to publish this one; very clean wave pattern. The only problem is that wave 3 should not be the shortest wave and this appears to be the case within wave 5. Make of this what you will but I am prepared to put it aside. Swing trade target is $3 for me. Longer-term, probably a 10x from he

STEMMy idea is that of a final move in a giant wedge that
developed in the direction of the primary trend, figure
failed below 1.70, the breakout of the figure currently
passes around 2.80

$STEM - Would you trade it?NYSE:STEM Okay. This is a risky trade. The stock is trading inside a decending wedge. It bounced off of the fib support.
MACD is showing bullish divergence. RSI is climbing.
Upside targets:
$4.50
$7
$9
$15
Downside risk:
$2.30

See all ideas
Summarizing what the indicators are suggesting.
Neutral
SellBuy
Strong sellStrong buy
Strong sellSellNeutralBuyStrong buy
Neutral
SellBuy
Strong sellStrong buy
Strong sellSellNeutralBuyStrong buy
Neutral
SellBuy
Strong sellStrong buy
Strong sellSellNeutralBuyStrong buy
An aggregate view of professional's ratings.
Neutral
SellBuy
Strong sellStrong buy
Strong sellSellNeutralBuyStrong buy
Neutral
SellBuy
Strong sellStrong buy
Strong sellSellNeutralBuyStrong buy
Neutral
SellBuy
Strong sellStrong buy
Strong sellSellNeutralBuyStrong buy
Displays a symbol's price movements over previous years to identify recurring trends.
Frequently Asked Questions
The current price of STEM is 14.99 USD — it has decreased by −6.20% in the past 24 hours. Watch Stem, Inc. stock price performance more closely on the chart.
Depending on the exchange, the stock ticker may vary. For instance, on NYSE exchange Stem, Inc. stocks are traded under the ticker STEM.
STEM stock has risen by 43.79% compared to the previous week, the month change is a 91.04% rise, over the last year Stem, Inc. has showed a −40.04% decrease.
We've gathered analysts' opinions on Stem, Inc. future price: according to them, STEM price has a max estimate of 20.00 USD and a min estimate of 7.00 USD. Watch STEM chart and read a more detailed Stem, Inc. stock forecast: see what analysts think of Stem, Inc. and suggest that you do with its stocks.
STEM reached its all-time high on Feb 17, 2021 with the price of 1,029.80 USD, and its all-time low was 5.81 USD and was reached on Apr 16, 2025. View more price dynamics on STEM chart.
See other stocks reaching their highest and lowest prices.
See other stocks reaching their highest and lowest prices.
STEM stock is 15.15% volatile and has beta coefficient of 1.79. Track Stem, Inc. stock price on the chart and check out the list of the most volatile stocks — is Stem, Inc. there?
Today Stem, Inc. has the market capitalization of 120.57 M, it has increased by 10.62% over the last week.
Yes, you can track Stem, Inc. financials in yearly and quarterly reports right on TradingView.
Stem, Inc. is going to release the next earnings report on Aug 7, 2025. Keep track of upcoming events with our Earnings Calendar.
STEM earnings for the last quarter are −3.00 USD per share, whereas the estimation was −3.66 USD resulting in a 18.11% surprise. The estimated earnings for the next quarter are −2.76 USD per share. See more details about Stem, Inc. earnings.
Stem, Inc. revenue for the last quarter amounts to 32.50 M USD, despite the estimated figure of 30.12 M USD. In the next quarter, revenue is expected to reach 32.47 M USD.
STEM net income for the last quarter is −25.00 M USD, while the quarter before that showed −51.14 M USD of net income which accounts for 51.11% change. Track more Stem, Inc. financial stats to get the full picture.
No, STEM doesn't pay any dividends to its shareholders. But don't worry, we've prepared a list of high-dividend stocks for you.
As of Jul 26, 2025, the company has 569 employees. See our rating of the largest employees — is Stem, Inc. on this list?
EBITDA measures a company's operating performance, its growth signifies an improvement in the efficiency of a company. Stem, Inc. EBITDA is −75.61 M USD, and current EBITDA margin is −85.71%. See more stats in Stem, Inc. financial statements.
Like other stocks, STEM shares are traded on stock exchanges, e.g. Nasdaq, Nyse, Euronext, and the easiest way to buy them is through an online stock broker. To do this, you need to open an account and follow a broker's procedures, then start trading. You can trade Stem, Inc. stock right from TradingView charts — choose your broker and connect to your account.
Investing in stocks requires a comprehensive research: you should carefully study all the available data, e.g. company's financials, related news, and its technical analysis. So Stem, Inc. technincal analysis shows the buy rating today, and its 1 week rating is buy. Since market conditions are prone to changes, it's worth looking a bit further into the future — according to the 1 month rating Stem, Inc. stock shows the neutral signal. See more of Stem, Inc. technicals for a more comprehensive analysis.
If you're still not sure, try looking for inspiration in our curated watchlists.
If you're still not sure, try looking for inspiration in our curated watchlists.