Safe Entry STEMPrice movement consolidating.
Safe Entry Green Zone.
Red Zone is Sell Zone. better watch out for any selling pressure.
P.high Lines Are Good Resitances.
Final Target 33.45$ price level.
better to wait stock and not follow.
Note: 1- Potentional of Strong Buying Zone:
We have two scenarios must happen at The Mentioned Zone:
Scenarios One: strong buying volume with reversal Candle.
Scenarios Two: Fake Break-Out of The Buying Zone.
Both indicate buyers stepping in strongly. NEVER Join in unless one showed up.
2- How to Buy Stock:
On 1H TF when Marubozu/Doji Candle show up which indicate strong buyers stepping-in.
Buy on 0.5 Fibo Level of the Marubozu/Doji Candle, because price will always and always re-test the
STEM trade ideas
STEM reboundstrong rebound of STEM in area 6, only the holding of this level could project towards the 11-13 area

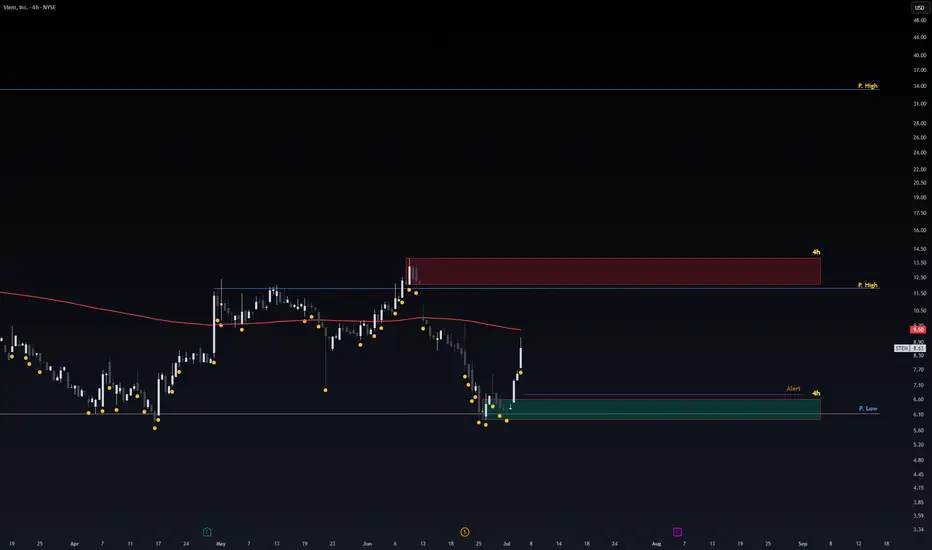
Just Crazy Thoughts of Crazy GainsStock showing Buying Power recent days.
Each Take Profit Line is where you may secure profit and run.
Re-testing the Green Zone 4H with Buyers Step-in is perfect.
Maybe we may not re-test it current price close at Support Level if it held for next session.
I believe we will see Gains of 500-1000%.
Each Line acts as Resistance level that worth watching with 15 TF in case any selling pressure secure profit is priority.
Note: 1- Potentional of Strong Buying Zone:
We have two scenarios must happen at The Mentioned Zone:
Scenarios One: strong buying volume with reversal Candle.
Scenarios Two: Fake Break-Out of The Buying Zone.
Both indicate buyers stepping in strongly. NEVER Join in unless one showed up.
2- How to Buy Stock:
On 15M TF when Marubozu Candle show up which indicate strong buyers stepping-in.
Buy on 0.5 Fibo Level of the Marubozu Candle, because price will always and always re-test the imbalance.
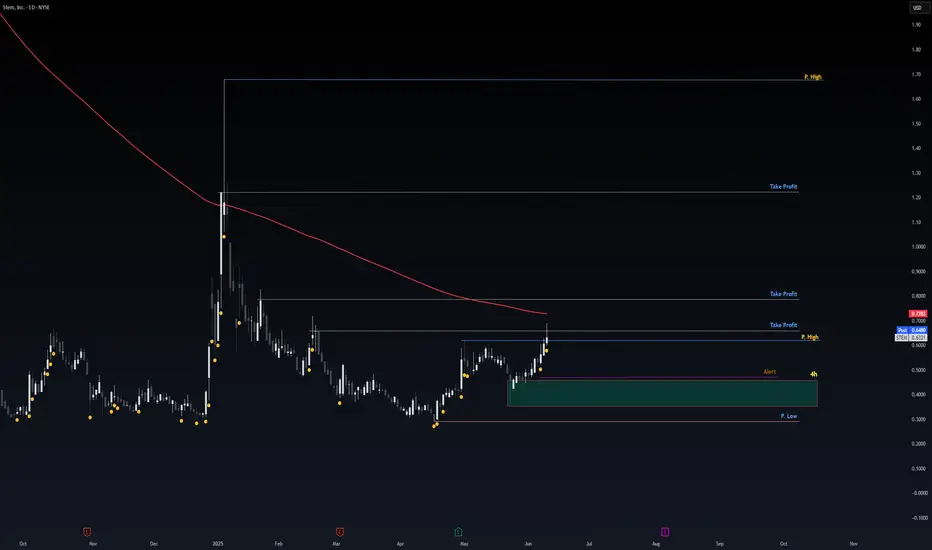
STEMFor STEM, the maintenance of the support in the 0.60
area is important, the breakout of the 0.82 level will
then be a significant signal for the resumption of the
positive trend, the loss of the 060 level is a signal that
could bring STEM back towards the lower support levels

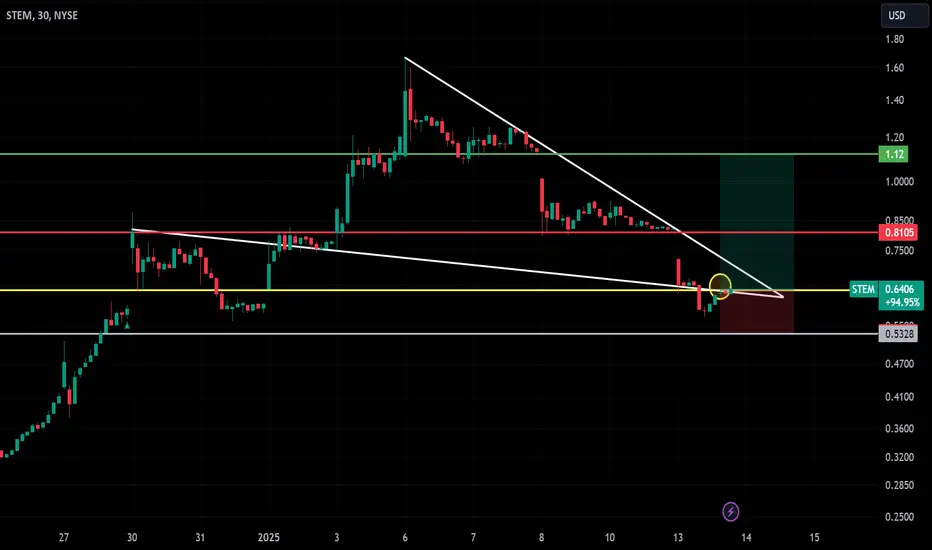
Filling the Gaps: Bullish Trade Setup !
💡Observations:
- Wedge breakout potential with gaps to fill! 🚀
🎯 **Plan**:
- **Entry**: $0.6283 📊.
- **Stop Loss (SL)**: $0.5328 🛑.
- **Target 1 (T1)**: $0.8105 🎯.
- **Target 2 (T2)**: $1.12 🚀.
⚡ A great risk-to-reward setup—watch for momentum! 🔍✨
@Tery021
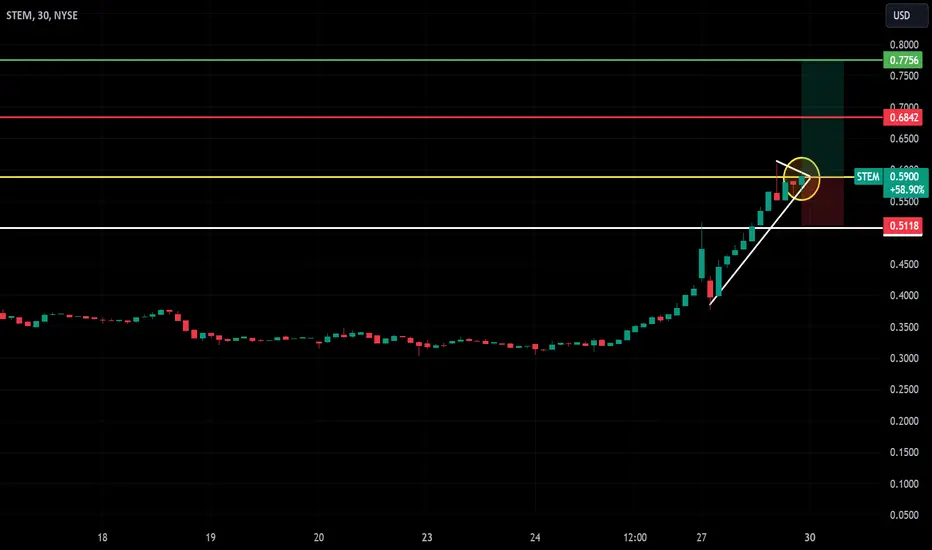
Momentum Breakout Trade on STEM!
Stop Loss (SL): Below 0.5118
Entry: Above 0.5900
Target 1 (T1): 0.6842
Target 2 (T2): 0.7756
Why Trade:
Breakout above resistance with strong volume and momentum.
Conclusion:
Defined risk-reward; monitor breakout sustainability for target achievement.
Pre-Earnings BreakoutNYSE:STEM
Looking at the downtrend line for STEM you will notice we have connected four touch points. Today the price action signaled a breakout above the trend line.
Second Image:
In the 'Second Image' we added the 50DMA and notice that yesterday 11Jul24 the stock closed above the 50DMA for the first time in 150 Days.
Entry Level: $1.33
Stop Loss: $1.20
Third Image (Gap 2 May 2024):
Profit Target 1: $1.78 gap from 2 May 2024
Moving Stop Loss: $1.30 after hitting target one and taking 50-75% in profits.
Profit Target 2: $2.00
Happy Trading.

STEM Likely BottomFelt an urge to publish this one; very clean wave pattern. The only problem is that wave 3 should not be the shortest wave and this appears to be the case within wave 5. Make of this what you will but I am prepared to put it aside. Swing trade target is $3 for me. Longer-term, probably a 10x from here to $13...

STEMMy idea is that of a final move in a giant wedge that
developed in the direction of the primary trend, figure
failed below 1.70, the breakout of the figure currently
passes around 2.80

$STEM - Would you trade it?NYSE:STEM Okay. This is a risky trade. The stock is trading inside a decending wedge. It bounced off of the fib support.
MACD is showing bullish divergence. RSI is climbing.
Upside targets:
$4.50
$7
$9
$15
Downside risk:
$2.30

$STEM - potential reversalNYSE:STEM is currently quite interesting. If you have the risk appetite, it could present a double bottom reversal trade opportunity.
It has been trading within a downtrend channel and recently hit an all-time low at $3.50.
If it can break above $5.06, there's potential for it to reach $7.76.
Here are the upside targets:
$5.06
$7.76
$10.50
Downside risk:
$3.50

STEM bearish channel brokenSTEM has finally broken out of a long term bearish channel and has tested the new resistance successfully
Now its making a very smooth HH and HL dow theory movement and an entry can be made when it makes a bounce from the current support level of 6.62
Entry @ 6.62
TP1 @ 9
TP2 @ 10.70
SL @ 5.60

STEM (Stem, Inc.) Buy TF D1 TP = 7.80On the daily chart, the trend started on May 4 (linear regression channel).
There is a high probability of profit. Possible take profit level is 7.80
But do not forget about the SL = 3.63
Using a trailing stop is also a good idea!
Please leave your feedback, your opinion. I am very interested in it. Thank you!
Good Luck!
Regards, WeBelieveInTrading

$STEM - Reversal formingNYSE:STEM looks like a reversal is forming. Broke out of descending wedge. Breaking above $6.70 would validate the reversal.
Targets - $7.76, $9.28
Downside risk - $3.93

Go long frenno words, just numbers and single letters
Alright tradingview forces me to use words. worst case scenario is a zigzag against the downtrend. more likely is that it bottomed out and has started an impulsive wave


$STEM Breakout Test - Risk on, w/ possible cycle back into greenHoping to see STEM breakout from it's current levels. Stock appears to be in a nice area I've been waiting for to load up a bit and hold for a nice swing trade. Just some simple TA and levels to pay attention to, I like the stock.

Tight Consolidation in StemClean-energy stocks have been one of the strongest parts of the market lately, and today’s chart focuses on a new battery-tech name: Stem.
The first pattern is the quick uptrend in late summer, fueled by the Inflation Reduction Act and strong quarterly results on August 4.
STEM halted at the December low of $16.76 and bounced twice around $13.60. The result is a potentially bullish “W” continuation pattern. Will traders expect more upside if the recent high is broken?
Next, the 50-day simple moving average (SMA) rose above the 200-day SMA last week. That “golden cross” may suggest its longer-term trend is getting more bullish.
Finally, MACD could be trying to turn positive again.
TradeStation has, for decades, advanced the trading industry, providing access to stocks, options, futures and cryptocurrencies. See our Overview for more.
Important Information
TradeStation Securities, Inc., TradeStation Crypto, Inc., and TradeStation Technologies, Inc. are each wholly owned subsidiaries of TradeStation Group, Inc., all operating, and providing products and services, under the TradeStation brand and trademark. You Can Trade, Inc. is also a wholly owned subsidiary of TradeStation Group, Inc., operating under its own brand and trademarks. TradeStation Crypto, Inc. offers to self-directed investors and traders cryptocurrency brokerage services. It is neither licensed with the SEC or the CFTC nor is it a Member of NFA. When applying for, or purchasing, accounts, subscriptions, products, and services, it is important that you know which company you will be dealing with. Please click here for further important information explaining what this means.
This content is for informational and educational purposes only. This is not a recommendation regarding any investment or investment strategy. Any opinions expressed herein are those of the author and do not represent the views or opinions of TradeStation or any of its affiliates.
Investing involves risks. Past performance, whether actual or indicated by historical tests of strategies, is no guarantee of future performance or success. There is a possibility that you may sustain a loss equal to or greater than your entire investment regardless of which asset class you trade (equities, options, futures, or digital assets); therefore, you should not invest or risk money that you cannot afford to lose. Before trading any asset class, first read the relevant risk disclosure statements on the Important Documents page, found here: www.tradestation.com .


STEM (Long) - boosted by the energy bill, lovely technical setupFundamentals:
- in the near term, the market seems to have found a temporary area of consolidation; that gives the trade enough time to develop
- the company is focused on the storage of renewable energy , thus it is a recipient of the US Inflation Reduction Act , which will substantially subsidise renewable energy companies
- Although it may seem like a no-revenue growth stock, the firm actually has a P/E of 24
- the whole renewable energy sector has been one of the strongest sectors in the market
Technicals:
- are just beautiful
- a rounding bottom reversal on the weekly; the breakout came on the day of the bill being passed (the fundamental reason behind a breakout always gives the trade more validity)
- Weekly RSI around 60 and breaking higher. The stock also broke through the weekly 50SMA
- The stock's relative strength against the S&P is just straight up and to the right
- Bull flag (or wedge or whatever you want to call it) after the breakout, a clear sign of consolidation; a continuation pattern
Trade:
- I found an entry at $16 (black line) as that level represents strong resistance from the upper side, and we broke it yesterday right at the close. However, the trade is still very much open to an entry; you wouldn't be chasing at this level
- Stop loss is tricky because the optimal stop loss (red line) is a bit too far away (14%). One way to play it is to use the $16 as a stop loss, though you risk a lot of whipsaws.
- The first profit target I found is the green line (25%)
Caveats:
- Market turns to the downside and drags this sector with it
- Inflation numbers are coming out on Tuesday; if we get a larger-than-expected number, probably leave the trade right away
Follow me for more analysis & Feel free to ask any questions you have, I am happy to help
If you like my content, Please leave a like and a comment, it motivates me to keep producing the ideas, thank you

WATCH $STEMBullish
- Round bottom
- Broke downtrend
- Broke neckline
- EPS +1
- Sales +1
- Funds accumulating
- Great fundamentals
Entry idea
- For members
Stop loss depending on entry and risk appetite. But always set meaningful stops.
“If you are depressed you are living in the past. If you are anxious you are living in the future. If you are at peace you are living in the present.”
Cheers and happy trading!

STEM STEM holding well,, if it can get tight under this line.. might be a good trade if it breaks through with vol.

STEM long setupSTEM operates as a digitally connected and intelligent energy storage network provider in the USA and internationally.
Above 50/100/200 EMA
High volume
Clean energy demand
Revenue beat in earnings report
