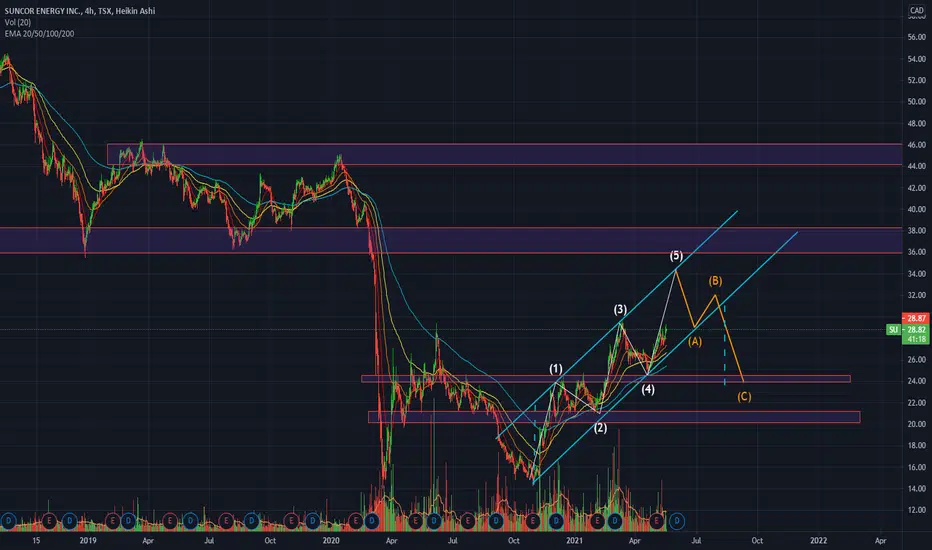
TSX:SU Long Swing ShortWith the rising wedge and decrease in volume, I think we can see a nice down move here in the coming months.
Happy Swinging,
Stefan
SU trade ideas

Weekly SU Chart, GEO style Weekly SU Canadian Chart to potentially see where price goes in the next while. Lotta numbers in that chart.

SU: Cup'n Handle (28%) Ascending Triangle (77%)Was asked by a follower to do Suncor. Was a great idea so here it is.
BTW, Suncor trades on both Canadian and US markets. So this applies applies for both markets.
Left hand side graph shows a confirmed Cup'n handle on the daily with a possible total gain of 28% and a price target of 30.83$. Not a lot, but still an uptrend.
Right top graph shows the weekly chart, this time with an ascending triangle (not confirmed) with possible gains of 77% for a price target of 45.67$. Still need to break the resistance level at 26$ to confirm the uptrend though.
Finally, the Energy sector is shown on the bottom right graph (weekly chart). Again, an ascending triangle (not confirmed) with possible gains of 77%. This reinforces the possible gains for Suncor as the Energy sectors rides in unison with Suncor. Energy sector has to break the 460$ resistance level to confirm.
Help if you can! Coins or Patreon.
Stay humble, have fun, make money!

"Sun"core will come out tomorrow A lot going on with SU.
Confirmed golden cross
Positive oil prices
Excellent balance sheet
broke through resistance and now setting up to fill the gap up tp 26.23.
The tank is full and we are ready to ride.


Suncor - an ideal candidate for Day TradingThe upward price pressure from the commodity versus the negative sentiment for the company make this a great candidate for day trading. As the gap grows between Suncor and its peers there are bigger opportunities to win on the overnight and morning dip/ afternoon dump.


Suncor BuyEntering if price cross 200MA
Bullish divergence on the RSI
Bouncing of support level
Macd Cross
Current macro economics situation is in my opinion bullish for oil

SU.to (Suncor)This is a possible path (speculative) into a good buy zone. I think we finished the 5 waves up in weekly so this daily corrective move (a-b-c-d-e) could possibly be only the leg A of the ABC weekly correction. Either way I see us continue the reversal if we break the 200MA. There is also a strong bullish divergence.
Over 25 I see 27 pretty easily.
Note : This is SU.to, not SU so the chart will match but not the $.

SUNCOR trade analysis, in downtrendThis stock relies heavily on the rapidly changing fundamental analysis with changing market conditions. Key support and resistance levels noted in orange on graph. Trend analysis, and trend directions noted in solid blue lines. With rapidly changing market conditions, this could create volatility.

NEW POSITION $SU Target 26.22 for 46.27%NEW POSITION $SU Target 26.22 for 46.27%
Next add level at 16.29
-----
—
On the far right of the chart is my Average (Grey) Current Target (Green), and Next Level to add (Red) Percentage to target is from my average.
ONLY ADD at support levels & FIB levels… labeled
I start every position with .5 - 1% of my account and build from there as needed and as possible.
I am not your financial advisor. Watch my setups first before you jump in… My trade set ups work very well and they are for my personal reference and if you decide to trade them you do so at your own risk. I will gladly answer questions to the best of my knowledge but ultimately the risk is on you. I will update targets as needed.
GL and happy trading.


SU, TIME TO BUY!Hello, fellow traders and investors SU and other oil & gas companies have sold off in the past weeks and they look like interesting buying opportunities. My personal favorite is suncor since it offers a good ROI and they are slightly profitable, unlike many others. If SU makes a recovery to the take-profit area it offers a 22% ROI.
Entry: Now
Take Profit: ~25.75$
Stop Loss: ~19.60$
Technicals:
-RSI=Oversold
-Moving averages still indicating a downtrend
Fundamentals:
-Description: Suncor Energy, Inc. is an integrated energy company, which develops petroleum resource basins. Its activities include oil sands development, and upgrading, onshore and offshore oil and gas production, petroleum refining, and product marketing.
- Market Cap: 32.96B
- Sales Last 12 Months: 20.61B
- P/E: 1402.67 (because of how low oil & gas sells for currently)
- P/S: 1.60
- Debt/Equity: 0.57
- Sales growth Q/Q: 17.50%
- EPS growth Q/Q: 123.40%
- Profit Margin: 0.10%
- Short Float: 0.61%
If you enjoyed the analysis make sure to like and follow for more! Thanks!


$SU in rising wedge and running up against .618SU looks to be setting up a rising wedge and running up against my 618 from pre-COVID high fibs. I cashed out my option and will get back in once I see whether it breaks down out of the wedge or if it pops through the 618. Last time I ignored a rising wedge I missed out on gains, so I followed the pattern this time! SU is still in overall great shape and I will be re-entering!


SU Last impulse wave before a correction/consolidationCurrently in a rising channel
5th Elliott Wave gets followed up with an ABC correction


SU Potential Pullback and Buying OpportunityWhile I think in general SU may retest it's highs in the 40's, I am looking at buying opportunities to load this one up with every dip. Looks like a bit of a pullback is coming (not big) as this continues to make it's way up as the summer months come. It is following its peak and valley pattern on the way up, and RSI indicates it should come down a bit.
With oil supplies going to be stressed with the US going to be in full bloom soon, and Canada slowly opening up and probably having more driving this summer (given we won't be flying much as we are still not out of the woods), I think this is a great time to get in.
I am still learning Fib retracements, so if anyone has some input on this and can provide much better support and resistance levels would be interested in hearing what your thoughts are and how to do them!


Potential Downside Suncor EnergyPotential downside idea for Suncor Energy. If the tide shifts to bearish for usoil we can see downward pressure on energy stocks such as suncor and perhaps a movement to the lower end of the channel

SU Starting to Break Out - Long TermIt looks like the SU trend of price increasing is going to hold. The RSI is in the right range, with the MACD and volume both suggesting a strong move up. With the summer months coming and the hope that Canada is opening up, we should see a surge of driving and oil use more than year to date and last year. Long term hold at this point and buying on dips?
