Stanley Black Stock Quote | Chart & Forecast SummaryKey Indicators On Trade Set Up In General
1. Push Set Up
2. Range Set up
3. Break & Retest Set Up
Notes On Session
# Stanley Black Stock Quote
- Double Formation
* (EMA Settings)) | Completed Survey
* (No Trade)) + Inverted Structure | Subdivision 1
- Triple Formation
* (Flag Structure) & Short Set Up | Subdivision 2
* (TP1) | Subdivision 3
* Daily Time Frame | Trend Settings Condition
- (Hypothesis On Entry Bias)) | Indexed To 100
- Position On A 1.5RR
* Stop Loss At 73.00 USD
* Entry At 63.00 USD
* Take Profit At 47.00 USD
* (Downtrend Argument)) & Pattern Confirmation
* Ongoing Entry & (Neutral Area))
Active Sessions On Relevant Range & Elemented Probabilities;
European-Session(Upwards) - East Coast-Session(Downwards) - Asian-Session(Ranging)
Conclusion | Trade Plan Execution & Risk Management On Demand;
Overall Consensus | Sell
SWK trade ideas

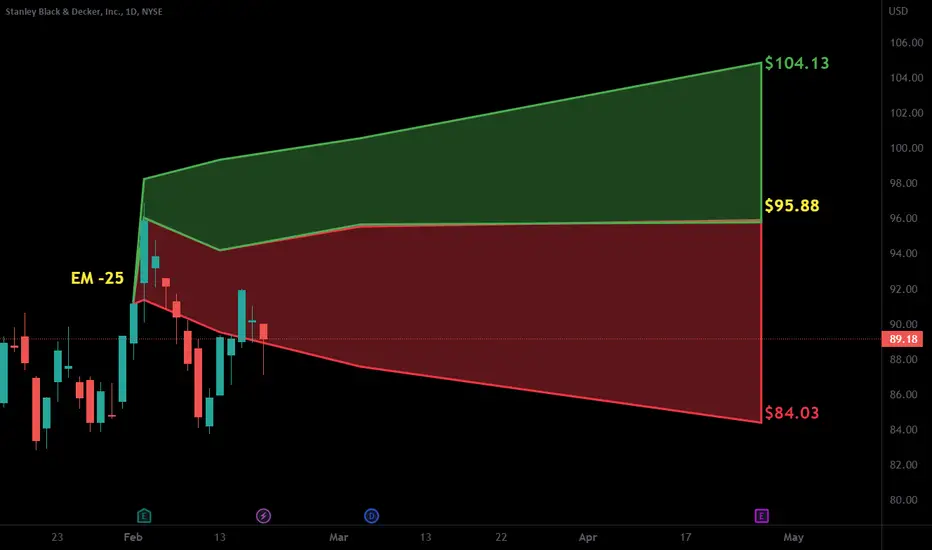
SWK: Bullish Potential, Key Levels to WatchClick Here🖱️ and scroll down👇 for the technicals, and more behind this analysis!!!
________________________________________________________
________________________________________________________
..........✋NFA👍..........
📈Technical/Fundamental/Target Standpoint⬅️
1.) Directional Bias: A slight bullish lean is observed, but requires stronger confirmation. A move above the yellow mid-channel line and a ""green flip"" of the moving averages (MAs) would significantly bolster this sentiment. Currently, the MAs are not showing a clear bullish signal.
2.) Post-Earnings Accumulation: While accumulation has been observed since the recent earnings announcement, it hasn't yet translated into significant volume increases. This suggests potential underlying interest, but a lack of immediate conviction. Monitor volume for a breakout.
3.) Financial Stability: Despite minor fluctuations, SWK's net income has remained relatively stable since 2022, demonstrating resilience in the face of market conditions. This provides a degree of fundamental support.
4.) Financial Health: The company has shown a positive trend in debt reduction from 2022 to 2024. While there have been slight declines in free cash flow and cash equivalents, these are relatively minor for a company of SWK's size and should be considered in the context of their overall financial health. Further investigation into the reasons for these declines might be warranted.
🌎Global Market Sentiment⬅️
1.) As we move into the historically bearish months of March and April, the market's direction in the coming weeks will be crucial.
==============================
...🎉🎉🎉Before You Go🎉🎉🎉…
==============================
Leave a like👍 and/or comment💬.
We appreciate and value everyone's feedback!
- RoninAITrader

Stanley Black & Decker | SWK | Long at $85.00Stanley Black and Decker NYSE:SWK breached my selected historical simple moving average and may likely be forming an upward channel into an overall positive reversal. It's "obeying" the simple moving average lines so far, with a nice bounce off the base at $85. Earnings and cash flow are expected to grow into 2026, but caution should be used if the economy slows further... It currently has a dividend yield of 3.74%. While I wouldn't be surprised if the price dipped to close out the price gap in the low $80s, NYSE:SWK is in a personal buy zone at $85.00.
Target #1 = $100
Target #2 = $114
Target #3 = $125
Target #4 = $137

Swing 1H trade LONG Hi check my oportunity. We go on 1h long position i trust X2 or X5 good risk reward. Good Luck. L.

Stanley Black & Decker Surges Why?Stanley Black & Decker shares jumped more than 8% Saturday after it boosted its profit forecast for the year. The tool maker said its cost-cutting efforts are paying off. Stanley now expects $1.10 to $1.40 in adjusted earnings per share in 2023, up from its past guidance of $0.70 to $1.30.
The tool maker said its cost-cutting efforts are paying off. Stanley now expects $1.10 to $1.40 in adjusted earnings per share in 2023, up from its past guidance of $0.70 to $1.30.
Stanley has been slimming itself for more than a year after the post-pandemic consumer pullback left it holding an outsize amount of inventory. The company said it has reduced that stockpile by $880 million so far this year, and by $1.7 billion since mid-2022.
Quarterly net sales slipped from the same period last year, coming in at just under $4 billion. But adjusted gross profit margins continued to grow, reaching 28%. The company’s goal is at least 35%.
As the company reduces the number of products it sells, Chief Executive Donald Allan Jr. defined the hierarchy of its brands. He said Craftsman, DeWalt and Stanley are in the top tier, while brands like Irwin, Lenox and Troy-Bilt will be used “in a more simplified way.”

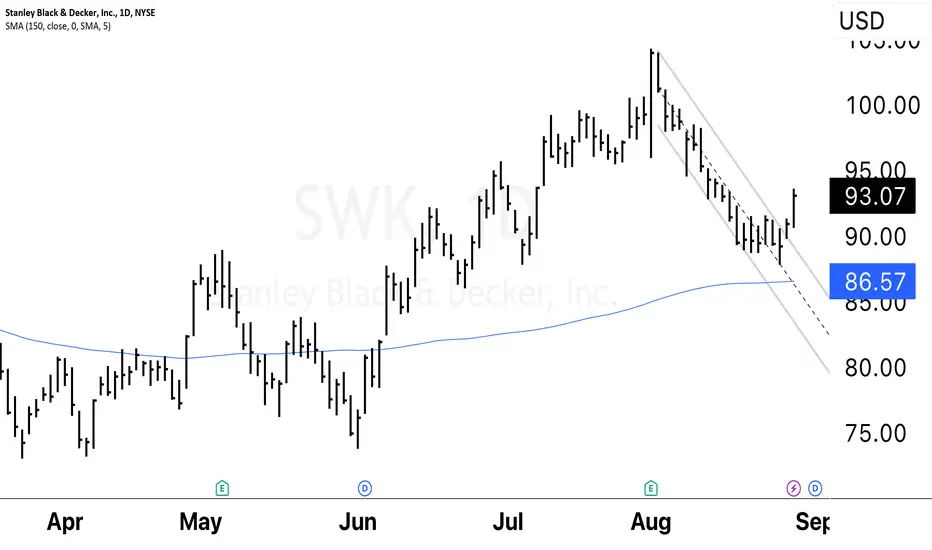
$SWK Bearish Parallel Down Trend BreakNYSE:SWK Bearish Parallel Down Trend Break to bullish reversal. The analysis of the potential bearish-to-bullish reversal in the context of NYSE:SWK (Stanley Black & Decker, Inc.) involves examining key price movements and technical patterns. Specifically, the break of a parallel down trend and its implications for a potential shift in sentiment.
**Bearish Parallel Down Trend:**
A bearish parallel down trend is characterized by a series of lower highs and lower lows. This pattern indicates a persistent downward movement in the stock's price. It suggests that sellers have been consistently in control, pushing the price lower over time.
**Break of the Parallel Down Trend:**
The breakout of a parallel down trend is a notable technical event. It signifies that the stock's price has broken free from the downward trajectory it had been following. This break suggests a potential weakening of bearish pressure and a shift towards more balanced or bullish sentiment.
**Implications for Reversal:**
The break of a bearish trendline doesn't guarantee an immediate bullish reversal but indicates that the downward momentum has subsided. It can be a precursor to a potential trend reversal, where buyers might start gaining more influence over the price direction.
**Confirmation and Analysis:**
To gain more confidence in the potential reversal scenario, consider the following factors:
1. **Volume Confirmation:** An increase in trading volume during the trendline breakout can confirm the legitimacy of the breakout. Higher volume suggests increased market interest and participation, supporting the idea of a trend reversal.
2. **Price Action Above Trendline:** After the breakout, monitor the price action. A sustained move above the trendline indicates that the stock is potentially transitioning to a more bullish phase.
3. **Support and Resistance Levels:** Identify key support and resistance levels on the chart. The breakout above the trendline might encounter resistance at previous support-turned-resistance levels. The ability to surpass these levels adds strength to the reversal argument.
4. **Moving Averages and Indicators:** Look at moving averages (such as the 50-day or 200-day) and technical indicators (like the Relative Strength Index or MACD) for additional confirmation of changing momentum and potential bullish sentiment.
5. **Market Context:** Consider broader market conditions, news, and company-specific factors that might influence the stock's price movement. External factors can play a significant role in validating or invalidating technical patterns.
It's important to remember that technical analysis involves probabilities, not certainties. While a bearish parallel down trend break suggests a potential bullish reversal, it's wise to combine technical analysis with other methods, such as fundamental analysis, to make well-informed trading decisions. Always be prepared for unexpected market movements and manage risk appropriately.
SWK - Head and shouldersOn this chart, we can see a head and shoulders-formation and we are therefore waiting for a breakout of the neckline, to take our short position.
Stop-loss, target and ROI are all shown on the chart.
The target for this trade equals the earlier support level.
In this case, it shows that during the last half year, it has formed into a multiple bottom, and our current target as bears, would be a good entry for the possible uptrend afterwards.

$SWK with a Bullish outlook following its earnings #Stocks The PEAD projected a bullish outlook for $SWK after a positive under reaction following its earnings release placing the stock in drift A with an expected accuracy of 100%.

SWK protective options strategyEveryone has some trusty item made by Stanley Black & Decker in their home, whether it's a power tool, lawn product, kitchen appliance, storage, etc. Its customers also include professional end users of its equipment for repairs, construction, lawncare, automotive, manufacturing, oil and gas pipelines, aerospace engineering and many other industries. It seems to be a broad, sprawling and necessary business. SWK is expected to report earnings in February, and is known to be a "safer" dividend stock. Technically minded investors might also see the falling wedge and double bottom as good signs.
On the other hand, this market and news cycle are still volatile week to week. Yesterday's optimistic stock market rally is today's fear of recession and debt ceilings. This investing strategy is a simpler way to boost gains and shield from losses, making up to 11% (11% annualized too) on $SWK options while also allowing room for a price drop of up to 23% before you lose any money.
Buy 1 $90 call
Sell 1 $95 call
Sell 1 $70 put
All expiring 1/19/24
Capital required: $6782


Stanley Black Decker USA Sun Storm Investment Trading Desk & NexGen Wealth Management Service Present's: SSITD & NexGen Portfolio of the Week Series
Focus: Worldwide
By Sun Storm Investment Research & NexGen Wealth Management Service
A Profit & Solutions Strategy & Research
Trading | Investment | Stocks | ETF | Mutual Funds | Crypto | Bonds | Options | Dividend | Futures |
USA | Canada | UK | Germany | France | Italy | Rest of Europe | Mexico | India
Disclaimer: Sun Storm Investment and NexGen are not registered financial advisors, so please do your own research before trading & investing anything. This is information is for only research purposes not for actual trading & investing decision.
#debadipb #profitsolutions

$SWK with a Bullish outlook following its earnings #Stocks The PEAD projected a Bullish outlook for $SWK after a Negative Under reaction following its earnings release placing the stock in drift D with an expected accuracy of 50%.

Head & Shoulders on $SWK weekly chartHead & Shoulders on $SWK weekly chart
- H&S formation on the weekly
- Broke down from support
- Passive income ? Cheap gets cheaper

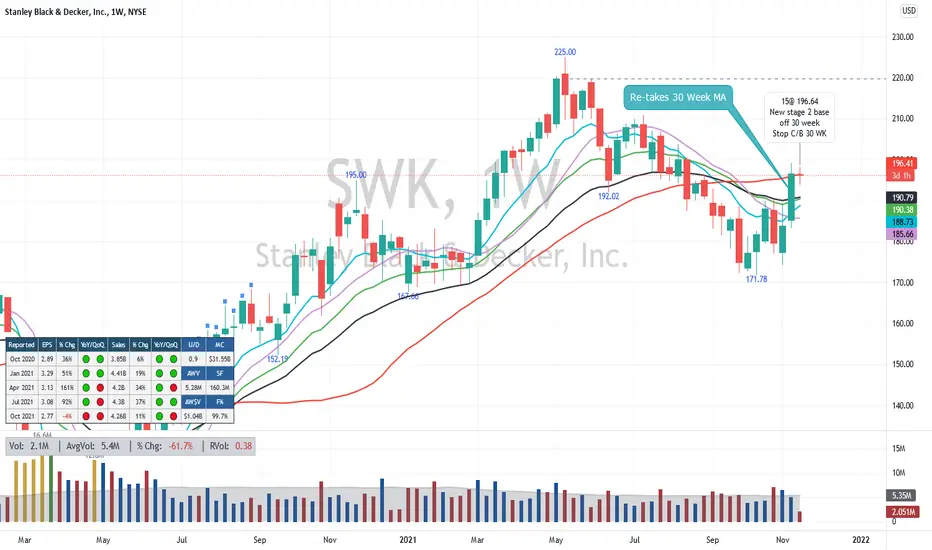
$SWK - New Stage 2 Base Breakout?I took a stater position in $SWK here as it comes up and over the 30 week MA. I had this on my watch list and it got away from me yesterday. I look at this as a low risk entry as my stop will be on a close below the 30 week MA which is not to far down. If this is the beginning of a stage 2 breakout I'm early and will have an opportunity to build the position out. All TBD. Ideas, not investing / trading advice.
SWK is target for dip buying festivalBased on historical movement, the trough could occur anywhere in the larger red box. The final targets are in the green boxes. The pending top should occur within the larger green box as has been the historical case. Half of all movement has ended in the smaller green box. In this instance, the signal indicated BUY on October 1, 2021 with a closing price of 173.87.
If this instance is successful, that means the stock should rise to at least 174.83 which is the bottom of the larger green box. Three-quarters of all successful signals have the stock rise 2.089% from the signal closing price. This percentage is the bottom of the smaller green box. Half of all successful signals have the stock rise 5.72% which is the end point of the black dotted arrow. One-quarter of all successful signals have the stock rise 9.332% from the signal closing price which is the top of the smaller green box. The maximum rise on record would see a move to the top of the larger green box. These are the same concepts for the levels in the red boxes as well.
The ends/vertical sides of the boxes are determined in a similar fashion. The peak of the rise can occur as soon as the next trading bar after signal close, while the max rise occurs within the limit of study at 40 trading bars after the signal. A 0.5% rise must occur over the next 40 trading bars in order to be considered a success. Three-quarters of successful movement occur after at least 5 trading bars; half occur within 17 trading bars, and one-quarter require at least 37 trading bars.
The black dotted arrow represents median historical movement. Medians are a good metric, but they are just one of many I use when forecasting future movement.
As always, the stock could decline the very next bar after the signal without looking back (therefore the red boxes would not come into play) or the stock may never decline (and the green boxes may never come into play).

$SWK- Stanley Black & Decker - Top Daily Gainer (Wedge Example)3/2/21
$SWK - Stanley Black & Decker - 2.6% Gainer
Catalysts:
1. Lengthy and now tightening consolidation of price in wedge formation, set up for reversal.
2. Stock is trading significantly below the Price Targets (PT) given by analyst upgrades and reiterations over the past couple months.
UBS - Buy - PT $227 --> $241
Citi - Neutral - PT $203 --> $215
Credit Suisse - Neutral - PT $177 --> $188
Morgan Stanley - Overweight - PT $220 --> $217
Barclays - Overweight - PT $184 - $210
-I'm going to be taking a look at some of the top daily gainers (may throw in some losers occasionally) of the day on their daily charts and posting them here throughout March. This is not advice. Just analyzing price action and patterns.
-I will try to vary the catalysts (analyst upgrades, earnings, clinical trial results, etc.) for the stock moving (if any) and the sector that the stocks are in.
-You'll notice I try to keep my charts as simple as possible. Black background and no grid. I will be focusing solely on price action, patterns, and support and resistance levels.
No moving averages, MACD, volume profiles, Bollinger bands, etc.
Please feel free to comment or leave suggestions. I am always looking to improve. Thanks.

Reversal SetupAfter 2 down months SWK might be heading back toward highs. Also showing positive rate of change divergence
Long here with a stop on a close below 167.00 with a target at 197.00

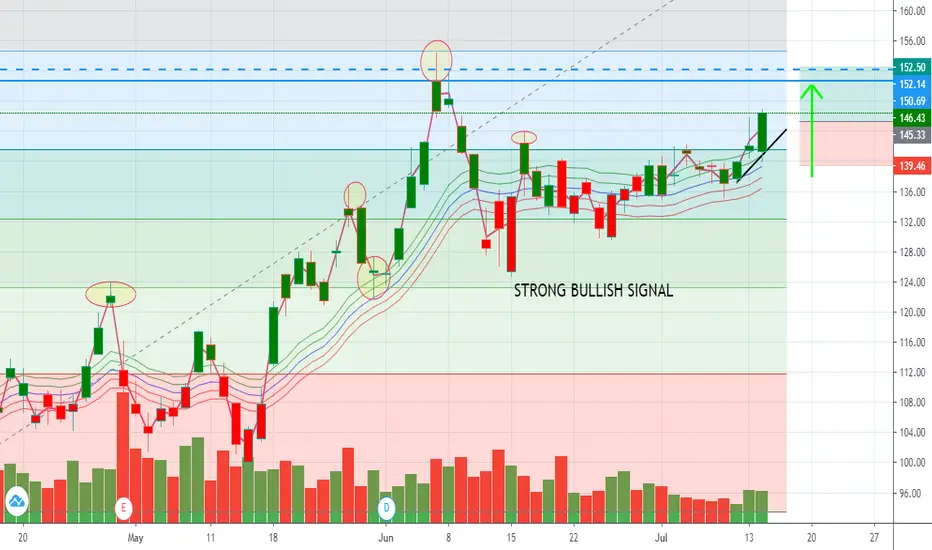
STANLEY BLACK & DECKER RecommendationHey my friends, STANLEY BLACK & DECKER is in a bullish momentum, fake propability of a reversal on the gap we can climb above the highest previous. After that it remains to be seen if the buyers set a price, otherwise we will witness a fall.
Please LIKE & FOLLOW, thank you!!
SWK is setup for successSWK just recently hit the support and is showing signs. This investment could be risky because the price is still below the 200 day moving average but if you wait until it crosses and holds above the 200 day moving average the reward is way less. Since hitting the support it is still on it's way to the resistnace which is $120.30

$SWK on Bounce Watch-list Oversold bounce potential on any reversal in market.
Short term trade only

SWK Stanley Black & Decker Inc in a support zone!Entering now !
Earning coming in the next days with good expectations...
So: technical analysis + fundamental in sync for bulls!!!

