TEL with the Nice setup due to shortfall in the trading rangeThere is a trading range with a potential breakout ready as there is a shortfall which usually tells the direction of the breakout which should begin to break resistance. The RSI is also trending up.
TEL trade ideas

Can Japan Weather the Semiconductor Tempest?In the intricate landscape of global semiconductor trade, Japan's recent decision to restrict exports of chipmaking equipment to China has ignited a tempest of geopolitical tensions. The move, while intended to limit China's technological advancements, risks triggering severe economic retaliation from Beijing. As a leading player in the semiconductor industry, Tokyo Electron finds itself caught in the crossfire, grappling with the potential consequences of this escalating dispute.
The semiconductor industry, a cornerstone of modern technology, is intricately intertwined with global economies. Disruptions to the supply of advanced chipmaking equipment could have far-reaching consequences, affecting industries from automotive manufacturing to artificial intelligence. The potential for economic retaliation from China, a major market for Japanese exports, further complicates the situation.
Japan's decision to impose export controls is driven by a strategic imperative to limit China's technological capabilities. However, this strategy carries significant risks. China has responded with a strong warning, threatening severe economic retaliation. The broader geopolitical context further complicates the situation, as the United States and its allies have been working to limit China's technological advancements.
The question remains: Can Japan successfully navigate this delicate balancing act, maintaining its economic interests while adhering to its strategic objectives? The answer to this enigma will likely shape the future of the semiconductor industry and the global technological landscape for years to come.

Video Recap On This "3 Step System"The rocket booster strategy is a very powerful
trading system and i want to share it with you so that
you can have a stepping stone into your trading
Journey, because even a small step ahead is better than no
step at all.
Trading is a very hard skill to understand, and so i want you
to take your time to learn it, eventually if you stay committed
you should learn more about it.
In this video, i share with you the Rocket Booster 3-Step System
Watch it now to understand more about this powerful system
Disclaimer: Trading is risky you will lose money wether you like it
or not, please learn risk management , and profit taking strategies.

$TEL with a Bullish outlook following its earnings #Stocks The PEAD projected a Bullish outlook for $TEL after a Negative Under reaction following its earnings release placing the stock in drift D with an expected accuracy of 40%.

TEL - Downward Move Within Up ChannelThe up strongest up channel can be drawn with a formation that formed very early (2012)
Red horizontal lines are top points along the up channel
We currently just experienced a top point along this channel and price is falling from its touch
I have placed a green box where I think price will recover on this Weekly timeframe

Can TEL leap tomorrow?Based on historical movement, the trough could occur anywhere in the larger red box. The final targets are in the green boxes. The pending top should occur within the larger green box as has been the historical case. Half of all movement has ended in the smaller green box. In this instance, the signal indicated BUY on March 16, 2022 with a closing price of 131.36.
If this instance is successful, that means the stock should rise to at least 132.945 which is the bottom of the larger green box. Three-quarters of all successful signals have the stock rise 5.319% from the signal closing price. This percentage is the bottom of the smaller green box. Half of all successful signals have the stock rise 7.592% which is the end point of the black dotted arrow. One-quarter of all successful signals have the stock rise 13.75% from the signal closing price which is the top of the smaller green box. The maximum rise on record would see a move to the top of the larger green box. These are the same concepts for the levels in the red boxes as well.
The ends/vertical sides of the boxes are determined in a similar fashion. The peak of the rise can occur as soon as the next trading bar after signal close, while the max rise occurs within the limit of study at 35 trading bars after the signal. A 1% rise must occur over the next 35 trading bars in order to be considered a success. Three-quarters of successful movement occur after at least 11.5 trading bars; half occur within 23.0 trading bars, and one-quarter require at least 33.0 trading bars.
The black dotted arrow represents median historical movement. Medians are a good metric, but they are just one of many I use when forecasting future movement.
As always, the stock could decline the very next bar after the signal without looking back (therefore the red boxes would not come into play) or the stock may never decline (and the green boxes may never come into play).


TEL - New Highs Incoming?TEL indicating a potential breakout of ascending triangle and break above linear regression mean after finding support at -2 standard deviation level.
*Confirmation of this breakout still needed to increase confidence of a run higher*
Analysis: Multiple bullish indicators suggesting high potential for break above linear regression mean to make new highs.
My bias is bullish due to the setup of the following.
RSI
RSI currently sitting at 59 with potential to break above 61 (an area I identify as corresponding with breakouts of resistance levels).
ADX/DI
Bullish directional index cross completed
MACD
MACD completed bullish cross.
After a short accumulation period in the $126 - $132 range, TEL appears to have broken out of this channel with intentions of making higher highs though confirmation is needed for this move.
Confirmation
Would like to see a daily close with a bullish impulsive candle breaking above the linear regression mean as well as $136.
This movement in price action would likely be supported by RSI moving above 61 into the red zone on my Fib RSI indicator.
TEL has a very highly correlated linear regression trend and a move above the mean into this range could be very fruitful, though I have set T1 at approx $153 for a potential profit of 14% on trade.
A trade taken from last candle close to T1 utilizing a S/L at $129 (approx 4% below current level) gives a R/R of 3.47
Low risk, good odds.
-Spreck


The Case of TE CONNECTIVITY DailyHey guys, TE CONNECTIVITY is on a bullish trend support, it is in full strength and bullish continuity. High volume of buying run, but we can see a further rise. There is a great likelihood of heading to the last precedent higher, if the buyers keep their momentum going they can look for the next point in the gap on its lower.
Please LIKE & FOLLOW, thank you!


Recently CLOSED Trades - ALEC / PS / TELHello traders!
Today I have got for you another Recently closed trades video. Take a look at some of our recent trades. What was the logic behind entry, what is the trade management and what are the results?
Tickers:
NASDAQ:ALEC
NASDAQ:PS
NYSE:TEL
John
FINEIGHT Team

TEL is about to quick bounceFED Talks brought everything down
should see a quick bounce to 72.22 the
highest.
Double Support
Momentum slowing on the downside
TTM


TELTEL has formed a nice cup and handle pattern. If it can breakout i'm looking for the $100 target level for roughly 5% gain and then the 102 level, which i'll put a trailing stop in once it reaches $100.


Looks bearishHigh red volume + Price action at the turning trend line: Bearish
The bearish channel has been holding up quite nicely in the last weeks.


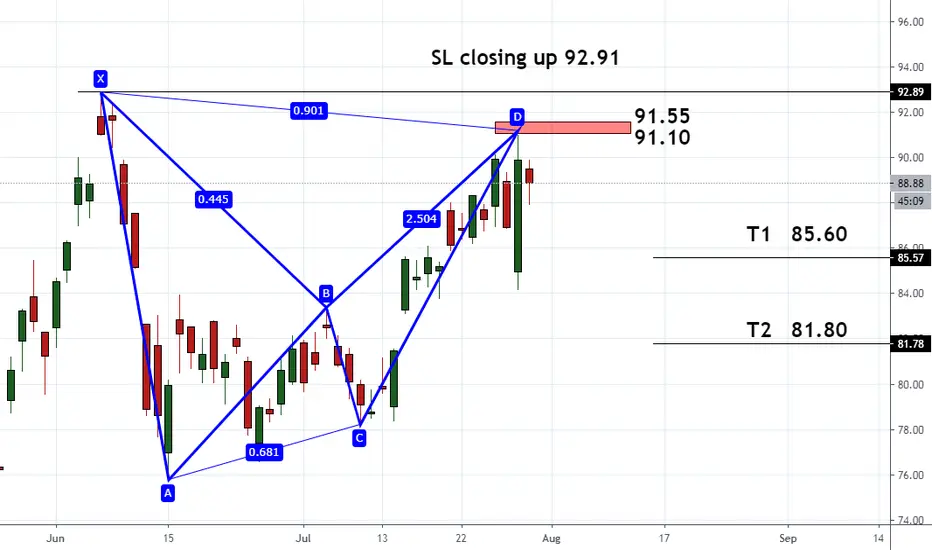
TEL: Nesting patterns on the 60mA small bat pattern is nesting inside a type t2 reversal off of a Gartley . Meanwhile, RSI has exhibits a complex structure in the overbought zone supporting the likelihood of price retesting the highs at a minimum. The 15m chart will tell if we get another entry opportunity. Given the range of the last few bars I think another chance at an entry isn't out of the question.

TEL(Weekly). Potential H&S. (IF), 200 and uptrend_Line confirm.Short on break.
TEL(Weekly). Potential H&S. (IF), 200 sma and uptrend_Line confirm.

TEL Day Trade Retest Gap (Brad Reed Jan27,2015)TEL expected to open at 65.62 for a Retest Gap. To learn to trade this strategy for free go to www.RealLifeTrading.com
