TEVA trade ideas

TEVA - A huge earning options bet Failed to notice this prior to closing. :(
Some big boy option trading firm expecting an explosive move on TEVA post earnings.
a total of 8307 Long Straddle Spread contracts were executed for a price of $3.65. That's approx = $3,000,000. For those who needs a further explanation, This is a non directional bet (either bullish or bearish) for the stock to open above $61 or below $54 by the end of next week.
Expected move is only $3.00

TEVA Shorting Opportunity Hello everyone, we have a potential pattern on this pair along with the structure . The targets are highlighted on the chart with two PRZ's.
Good Luck
For info: kevinsdhaliwal@hotmail.com
Twitter: kevindhaliwal1
Instagram: AllTradingIdeas


Accumulation below the level of the earning level.Accumulation below the level of the earning level.


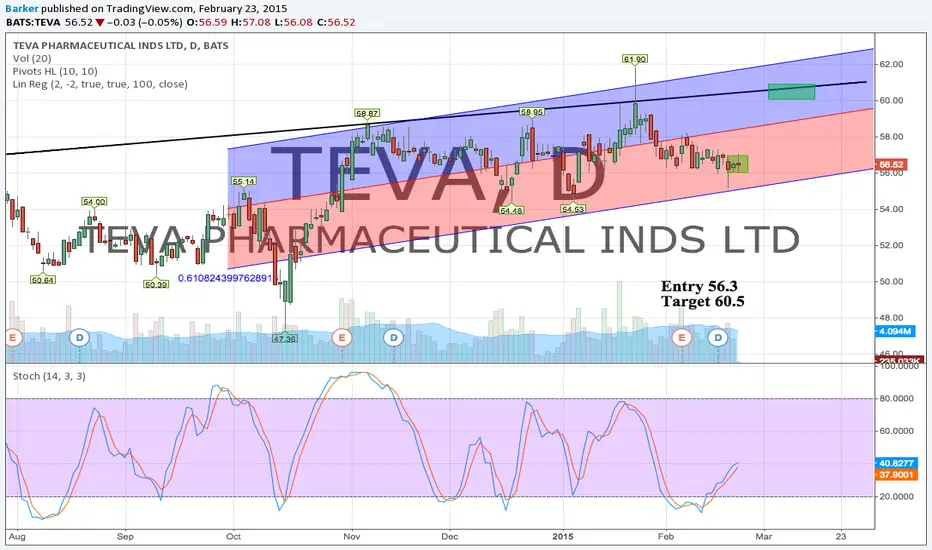
About to break down trend line support?The members received a bearish continuation setup (to the already profitable AB=CD pattern) yesterday to short $TEVA near 65$ resistance zone.
That setup turned out to be very successful but I'm looking for a stronger bearish move if $TEVA will break down the top of it previous trading channel.
Join the members if you like harmonics and you wish to get this kind of analysis during the trading week to your email
www.themarketzone.net - Press the Elite Zone tab and subscribe


Coming strong into resistance - Triple Top$TEVA is coming strong into a resistance zone just before its earnings.
Triple top and a re-test of broken uptrend line will stand in its way and may be a good reason to try and short it.
Bulls? Breakout? Wait to confirm before you enter. Notice volume.

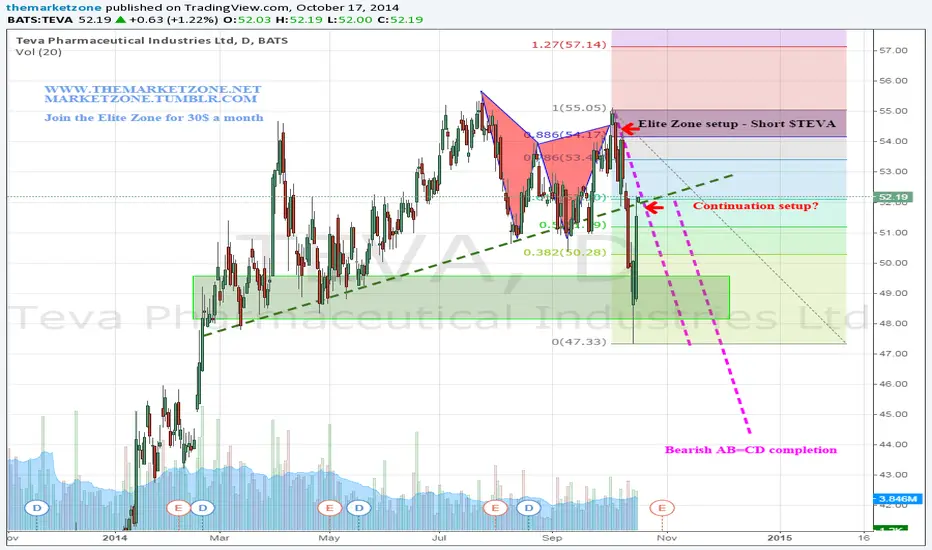
Possible downward continuation setupThe bearish Gartley we used in the Elite Zone to short $TEVA from the 55$ zone generated a 8$ downward move in the stock.
Now that $TEVA bounced from support to complete its 61.8 Fib retracement, is it the time to jump on the bearish continuation trade?
"Aggressive C sell" scenario in a possible bearish AB=CD pattern.
As long as the stock stays below broken trend line, this scenario may work.
Target - Completion of AB=CD pattern near 44$
If you wish to join the Elite Zone, you can do so in the MarketZone website: WWW.THEMARKETZONE.NET

tevaon the weekly chart it seems that we are in an uptrend and it seems that the moving average 21 periosi (area 52) is currently working well as support so it is very likely that prices will come in area 55

A good starting position. Judging on bearish divergences that may be suitable, also, for short positions.

TevaI am watching to Teva for long time when price was going in trading range. Teva break up the 2 years old resistance. Now it looks like trading range again. My target is around 62-63 USD per share.

Pattern of "head and shoulders" continues to be formed.Pattern of "head and shoulders" continues to be formed.
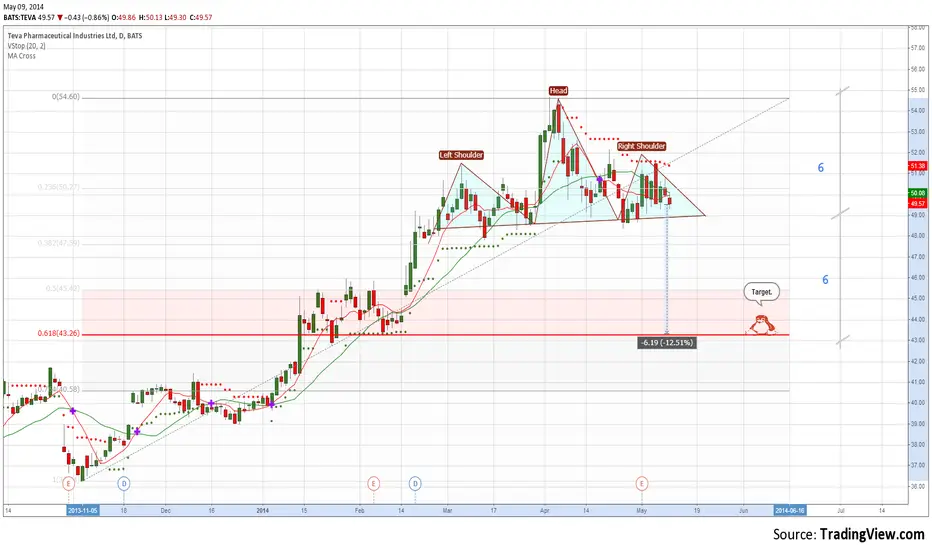
The correction is completed.First, we must wait for the breakout of the psychological level of 50. After that, wait for a signal from parabolic SAR.
This will mean that we now have a trigger on a short position.

Teva Pharmaceuticals TEVA Rally Time is Over and Sell SignalThe "time at mode" concepts are shown here:
A trend is when new highs occur every 5-days:
If above the "most frequent price" of a trend, then once above the mode the market can rally by the number of bars as are at the mode.
So, the "17" shows 17-days at one price and the projection is based on the price range from the first to the last bar that are touching those 17-days.
Another "16" day mode sets up and that time has expired after an initial overshoot of the target.
Now there is no new high for 5-days and a downtrend in place, but with only 8 days at a mode. If at the end of today, the price is below the red line, this becomes a sell signal with the targets labeled.
This is a great UPTREND that worked out very nicely with Soros buying a big position just ahead of the rally, but now that earnings are coming out in a few days, there is a chance that prices could soften ahead of the news. I'd suggest exiting prior to the earnings.
Cheers.
Tim 12:00PM EST 4/24/2014

TEVA PHARMA - TEVA - UPTREND BUYTEVA: UPTREND
It's hard to see the stock market correction when you look at this stock chart. TEVA has lagged the market for quite some time and it appears to be lifting from a minor correction.
Risk to 44 for short term traders:
Upside to 46.50 for short term:
Tim 1:53PM EST 2/5/2014
