TFX trade ideas
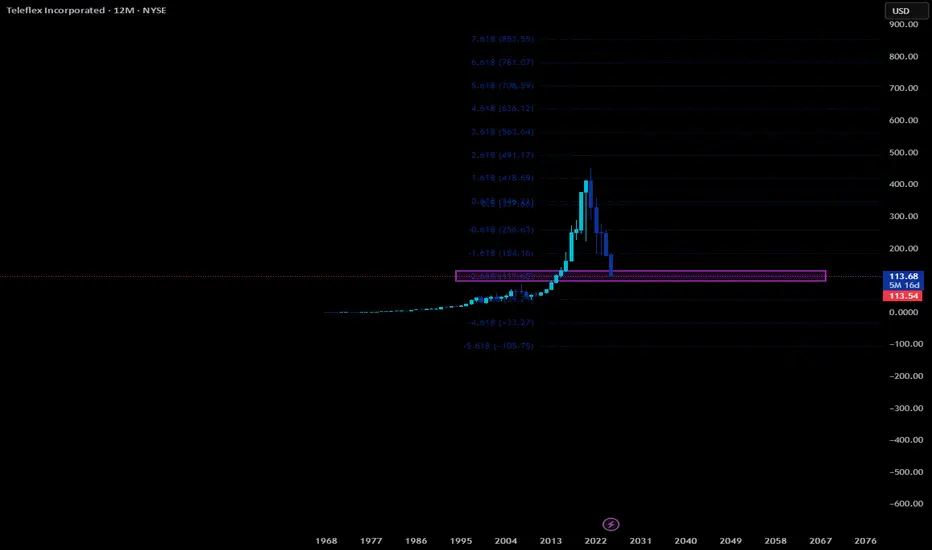
TFX Long IdeaUntested level on the yearly chart that comes from my proprietary fib pulls. I will take a long here upon first touch with expectation to test the next level up. Really need this stock to hold this box or it is going even lower.

Teleflex Incorporated
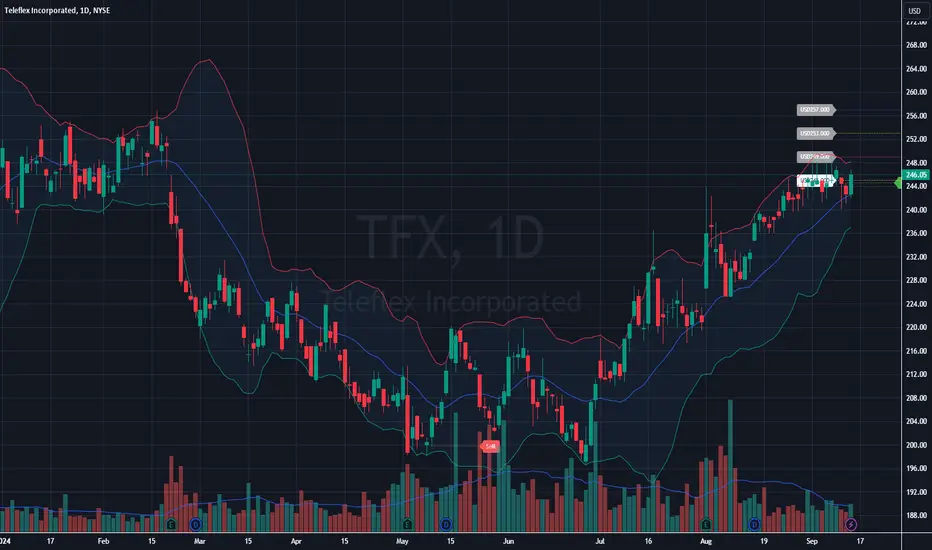
There was a recent minor pullback, but the price is attempting to resume the uptrend as it has bounced back to the upper side of the Bollinger Bands.
Middle Line (SMA): This line is being used as support, and the price bouncing off this level further supports the uptrend.
In the most recent days, volume has decreased slightly, suggesting that the current move higher may lack strong conviction.
Support: The recent low around $196.49 (lower Bollinger Band region) serves as key support.
The 50-day moving average currently around $240 is also acting as dynamic support.
Resistance: $252-256 represents an important resistance zone, as indicated by the highs in July and early September. If the price breaks above this zone, it could confirm a continuation of the uptrend.
Current Bias: Bullish, with the price trading above the 50-day moving average and the middle Bollinger Band.
Short-Term Outlook: The stock might experience a slight consolidation or pullback in the near term, as the price approaches resistance near $252-256. However, the broader trend remains up.
Long-Term Outlook: As long as the price stays above the 50-day moving average, the overall trend is bullish.
TFX Coin Weekly OutlookOn Weekly Chart of TFX
- Head & Shoulder Pattern showed up from Nov 2020 and breaking the 'neck' on Nov 2021.
- Price keep making breaking of structure (BOS)
- Price moving towards closest support at the price of 182.93
Key Point?
1) If Break 182.93, price contiue bearish to the next support at 140.00
2) No hint of changing trend to bullish
3) MACD still going strong on bearish

$TFX with a Bearish outlook following its earnings #Stocks The PEAD projected a Bearish outlook for $TFX after a Negative Under reaction following its earnings release placing the stock in drift D with an expected accuracy of 57.14%.

Teleflex awarded Central Venous Access contract from VizientTFX: Teleflex Incorporated
2022-08-01 06:30:00
Teleflex awarded Central Venous Access contract from Vizient

$TFX with a Bearish outlook following its earnings #Stocks The PEAD projected a Bearish outlook for $TFX after a Negative Under reaction following its earnings release placing the stock in drift D with an expected accuracy of 66.67%.


the b[AI]te's weekly insights -- TFX 2021-03-08center stage image
stock
our system found that TFX received the best image over the course of last week.
comment image
we see a moderate negative correlation with our image indicator. We therefore assume that prices are driven partial emotionally as there is probably some other catalyst with regard to the company resulting in an uncertain pricing.
new free tool
we launched our new free analysis tool. Check our website and test it out!
new free and powerful data API
you can now access our data via our free API . Check our website and test it out!
FAQ
ATTENTION
our algorithms define ATTENTION as the overall number of stories and opinions that appear for a given security each day.
IMAGE
our algorithms define IMAGE as the averaged sentiment value extracted from all opinions received for a given security per day.

Teleflex w48 2020. Short with TP 302Monthy
Uptrend with divergency
Weekly
Range on highs + Divergency
Daily
Open SHORT 376
SL 293
TP 302
RR 4.2

monthly analysis of TELEFLEX INCHi friends
The monthly chart of this market shows that it will see great potential for an uptrend in the next few days, but we must also be vigilant to change the trend towards the opposite.
Please subscribe to receive new analyzes

Teleflex could rally to 450+With the increase in sales of surgical masks we could see Teleflex shares start to rally as a result of the COVID-19 pandemic.

TFX - Buyers In ControlTFX stock had a big fast slide (over 40%) but a big fast recovery as well
both times 360-363 area acted as resistance
after a nice move on friday price closed above resistance and looking on its way for February highs
374 can be a small hurdle but 400 is on its way

TFXSystem T Performances: Annual Compound Profit 40%, Win Rate 55%, Risk/Reward Ratio 1:2, 20 Years of Backtesting Data, Over 100 Markets.
* Click Like and Follow to Support My Work!
---
Hi Traders,
I'd like to introduce the System T, a computerized trading system that analyzed and backtested the 20 years history data of over 100 markets.
This post is my sharing of how I think about systematic trading and the signals generated by the System T.
(This is my opinion only, NOT the financial advice.)
I think that for the system to open a trade and manage risk, it only needs a buy signal & a stop-loss signal clearly on the chart.
Once the system finds a good trend, it will ride it as long as possible. The stop-loss will be adjusted accordingly to the new price movement.
(Remember to follow this trade idea and follow my profile to get updates about the stop-loss adjustment and sell signal based on the latest price and market conditions daily.)
System T performances above will give you an idea of how it performs in the last 20 years.
Notice that this result was achieved only if I strictly followed the rule: "Only and Always Buy & Sell based on the System Signals".
Don't sell when there is no sell signal as we all want to follow the good trends til the end like everything in life does. \(^-^)/
Also, my system is extremely diversified through over 100 markets so that it only risks less than -1% of the total capital per trade.
Thank you and good luck!
---
DISCLAIMER:
I am NOT a financial advisor, and nothing I say is meant to be a recommendation to buy or sell any financial instrument.
My views are general in nature and I am not giving financial advice. You should not take my opinion as financial advice. This is my opinion only.
Do your own due diligence, and take 100% responsibility for your financial decisions.
Trading and investing are risky! Don't invest money you can't afford to lose, because many traders and investors lose money. There are no guarantees or certainties in trading.
- Content is for education purposes only, not investment advice.
- Trading involves a high degree of risk.
- We’re not investment or trading advisers.
- Nothing we say is a recommendation to buy or sell anything.
- There are no guarantees or certainties in trading.
- Many traders lose money. Don’t trade with money you can’t afford to lose.

wutang to 348-350just a prediction. also a zone on 4h around 348. weekly looked like a bear flag but seems like it held. we'll see.

TFXSystem T Performances: Annual Compound Profit 40%, Win Rate 55%, Risk Reward 2:1, 20 Years of Backtesting Data! Follow me for my Buy & Sell signals!


TFX Potential BreakoutTFX is at the top of a ascending triangle.
Entry: 212
PT: 222.60- 233.20
SL: 206.70
NYSE:TFX

TFX - Inverted Flag formation short from $145.93 to $132.13 TFX broke-down long tern trend in weekly frame, retested it from beneath & now falling down. In the daily frame it is forming a bear flag formation & related upward channel. Both pattern suggestion a decline & we are looking for a short if it breaks below $145.93 & our first target is $132.13
You can check our detailed analysis on TFX in the trading room/ Executive summary link here-
www.youtube.com
Time Span- 4:30"
Trade Status: Pending


Volume and price are positivein a difficult week - looking for new highs
reached the target on 2nd Dec 2013
