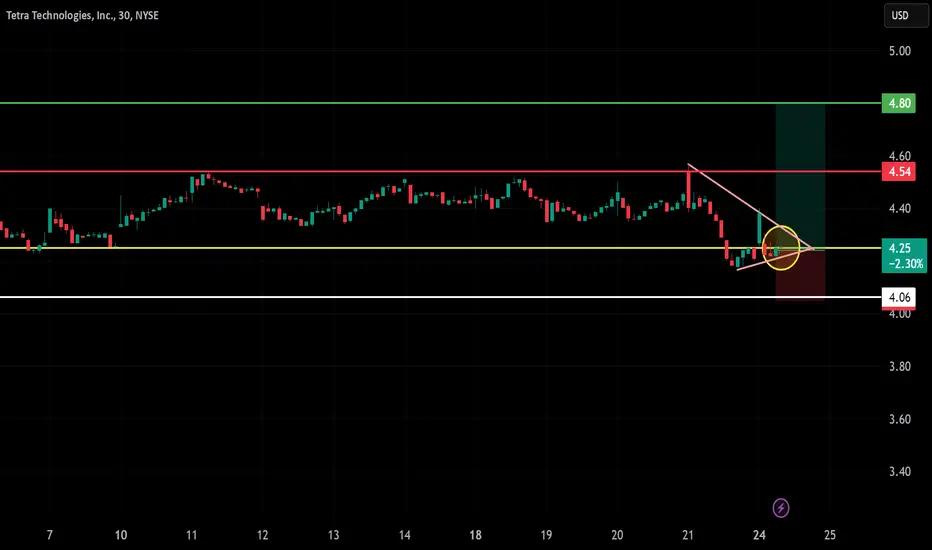
TTI – 30-Min Long Trade Setup!📌
🔹 Asset: Tetra Technologies, Inc. (TTI)
🔹 Timeframe: 30-Min Chart
🔹 Setup Type: Descending Wedge Breakout Long Trade
📌 Trade Plan (Long Position)
✅ Entry Zone: Above $4.26 (Breakout Confirmation)
✅ Stop-Loss (SL): Below $4.06 (Break of Support & Trendline)
🎯 Take Profit Targets
📌 TP1: $4.54 (Fi
Next report date
—
Report period
—
EPS estimate
—
Revenue estimate
—
0.87 USD
108.28 M USD
599.11 M USD
125.56 M
About Tetra Technologies, Inc.
Sector
Industry
CEO
Brady M. Murphy
Website
Headquarters
The Woodlands
Founded
1981
FIGI
BBG000BVRQD7
TETRA Technologies, Inc. is an energy services and solutions company, which focuses on developing environmentally conscious services and solutions that help make people’s lives better. It operates through the Completion Fluids and Products Division and Water and Flowback Services Division segments. The Completion Fluids and Products Division segment manufactures and markets clear brine fluids, additives, and associated products and services to the oil and gas industry. The Water and Flowback Services Division segment offers onshore oil and gas operators with comprehensive water management services. The company was founded in 1981 and is headquartered in The Woodlands, TX.
Related stocks
Prepare to follow price within Range upwardsWIth a support of 4usd being maintained and previously broken quite easily in DEC 2024 shortly after being rejected above 5USD the potential for this ticker TTI has much more room for growth on a longer term aspect. Price continues to maintain its upwards tragectory, Fundamentally this stock is und

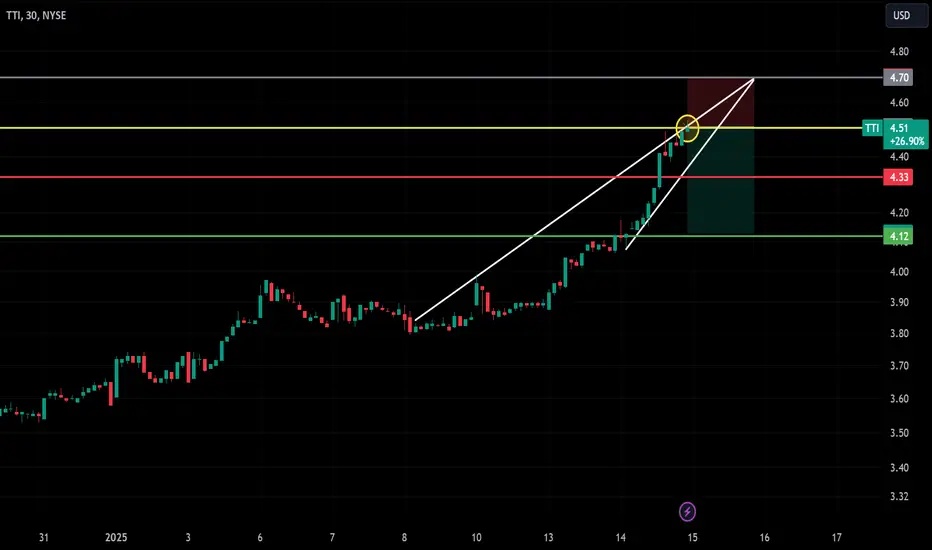
TTI Short Trade Setup | Entry, SL, T1, T2 !Type: Short Trade 📉
Entry Point: $4.50 (or your precise entry from the chart)
Stop Loss (SL): $4.70 (marked in red) 🚫
Target 1 (T1): $4.33 (marked in yellow) 🟡
Target 2 (T2): $4.12 (marked in green) ✅
Reason for Short: Rising wedge pattern breakdown with a potential rejection near resistance at $4.7
TTI - LONGNeuberger Berman Group LLC recently acquired Tetra Technologies Inc., showing their belief in the company’s potential for growth, especially in the energy sector. Hedge fund interest in Tetra is stable, with 22 holders still invested, reflecting ongoing confidence in its performance. The company is

TTI: Bullish Pennant, confirmed (56,08%)(23/1000)(23/1000)
Bullish Pennant pattern for TTI. Confirmed
56,08% possible gains.
Pros:
1- PPS above 50MA and 200MA
2- RS above 0 and climbing
3- R/R ratio above 5
4- 250RSI above 50 and climbing
5- 50MA above 200MA
6- Both 50MA and 200MA ascending
7- Golden cross circled in blue
8- Descending volume d

TTITechnical only :
Adding to my watch list in order to get a direction from the market.
There is a positive and a negative scenario.
Positive scenario - W pattern - Our first entry will be above 4.20 and our second entry will be above 4.50 with potential target of 5.75$.
The negative scenario -

$TTI ~ Correction in progress...As shown, majority of energy stocks are starting to correct. Looking into the future, we believe these companies will provide amazing opportunities. We expect barrels of oil to reach $300-400 a barrel by the end of the decade. Recommend tracking this sector very closely for amazing opportunities.

Tetra Technologies (TTI) RECALL ALERT!Hello everyone,
It is with the utmost conviction that I must return to a trade posted on June 7th, 2022, and admit, I was WRONG. I have to own it... the breakout has failed; I have stopped out of this trade.

Tetra Technologies (TTI) Breaking outI have bought TTI and I am looking for $15ish, where I will plan to reduce 50% and hold until it reaches the all time high near $30.


See all ideas
Summarizing what the indicators are suggesting.
Neutral
SellBuy
Strong sellStrong buy
Strong sellSellNeutralBuyStrong buy
Neutral
SellBuy
Strong sellStrong buy
Strong sellSellNeutralBuyStrong buy
Neutral
SellBuy
Strong sellStrong buy
Strong sellSellNeutralBuyStrong buy
An aggregate view of professional's ratings.
Neutral
SellBuy
Strong sellStrong buy
Strong sellSellNeutralBuyStrong buy
Neutral
SellBuy
Strong sellStrong buy
Strong sellSellNeutralBuyStrong buy
Neutral
SellBuy
Strong sellStrong buy
Strong sellSellNeutralBuyStrong buy
Displays a symbol's price movements over previous years to identify recurring trends.
Frequently Asked Questions
The current price of TTI is 3.92 USD — it has increased by 0.77% in the past 24 hours. Watch Tetra Technologies, Inc. stock price performance more closely on the chart.
Depending on the exchange, the stock ticker may vary. For instance, on NYSE exchange Tetra Technologies, Inc. stocks are traded under the ticker TTI.
TTI stock has fallen by −3.69% compared to the previous week, the month change is a 11.36% rise, over the last year Tetra Technologies, Inc. has showed a 24.05% increase.
We've gathered analysts' opinions on Tetra Technologies, Inc. future price: according to them, TTI price has a max estimate of 7.00 USD and a min estimate of 5.00 USD. Watch TTI chart and read a more detailed Tetra Technologies, Inc. stock forecast: see what analysts think of Tetra Technologies, Inc. and suggest that you do with its stocks.
TTI stock is 3.83% volatile and has beta coefficient of 1.45. Track Tetra Technologies, Inc. stock price on the chart and check out the list of the most volatile stocks — is Tetra Technologies, Inc. there?
Today Tetra Technologies, Inc. has the market capitalization of 522.46 M, it has increased by 0.78% over the last week.
Yes, you can track Tetra Technologies, Inc. financials in yearly and quarterly reports right on TradingView.
Tetra Technologies, Inc. is going to release the next earnings report on Nov 3, 2025. Keep track of upcoming events with our Earnings Calendar.
TTI earnings for the last quarter are 0.09 USD per share, whereas the estimation was 0.08 USD resulting in a 9.76% surprise. The estimated earnings for the next quarter are 0.03 USD per share. See more details about Tetra Technologies, Inc. earnings.
Tetra Technologies, Inc. revenue for the last quarter amounts to 173.87 M USD, despite the estimated figure of 173.65 M USD. In the next quarter, revenue is expected to reach 143.34 M USD.
TTI net income for the last quarter is 11.30 M USD, while the quarter before that showed 4.05 M USD of net income which accounts for 179.20% change. Track more Tetra Technologies, Inc. financial stats to get the full picture.
No, TTI doesn't pay any dividends to its shareholders. But don't worry, we've prepared a list of high-dividend stocks for you.
As of Aug 10, 2025, the company has 1.4 K employees. See our rating of the largest employees — is Tetra Technologies, Inc. on this list?
EBITDA measures a company's operating performance, its growth signifies an improvement in the efficiency of a company. Tetra Technologies, Inc. EBITDA is 101.30 M USD, and current EBITDA margin is 14.31%. See more stats in Tetra Technologies, Inc. financial statements.
Like other stocks, TTI shares are traded on stock exchanges, e.g. Nasdaq, Nyse, Euronext, and the easiest way to buy them is through an online stock broker. To do this, you need to open an account and follow a broker's procedures, then start trading. You can trade Tetra Technologies, Inc. stock right from TradingView charts — choose your broker and connect to your account.
Investing in stocks requires a comprehensive research: you should carefully study all the available data, e.g. company's financials, related news, and its technical analysis. So Tetra Technologies, Inc. technincal analysis shows the strong buy rating today, and its 1 week rating is strong buy. Since market conditions are prone to changes, it's worth looking a bit further into the future — according to the 1 month rating Tetra Technologies, Inc. stock shows the buy signal. See more of Tetra Technologies, Inc. technicals for a more comprehensive analysis.
If you're still not sure, try looking for inspiration in our curated watchlists.
If you're still not sure, try looking for inspiration in our curated watchlists.