$TWTR EASY PLAYY!!Just broke above resistance here now looking to take this a little higher back to around $73.20
we have one candle stick confirmation breakout
TWTR trade ideas

TWTR looks up for the near futureTWTR is overdue to test its previous high from July
- The bottom of the recent downtrend offers a bullish divergence pattern
+ Friday gave conformation of pattern
- Fibonacci Retracement put resistance level at $69.61
+ suggest using support level before
- TWTR looks to break trend line September 27
+ look for a bounce off support level for entry
+ 50 EMA was a previous support level
There may be a lot of selling of TWTR earlier in the day September 27, but the potential down vote the infrastructure deal may offer a new trend line.
** for details on the infrastructure bill and how it will impact tech stocks check out my idea on my recent MSFT post

TRIANGLE AND VOLUMES OR NEWS - TWTR - WEEKLYNEWS ?
Twitter news about an integration of Bitcoin tipping feature is huge. Twitter might become a central social network allowing people to use crypto and transfer money for a very cheap fee. Is this feature looking like little thing will announce the end of western union services requiring huge fees to send money overseas.
TRIANGLE AND VOLUMES ?
The black line represents the probable strongest support.
The price is following is going up overall but the tops are getting lower.
Potential pull back up on the black horizontal strong support.
Potential increase of twitter's price in the coming weeks. specially if the price reaches the black line area.
so news or triangle/volume ?
Thanks for the like and shares, really appreciated! This is not financial advice, just an idea .

TWITTER going for all time highsTwitter closed above the 50 MA today 9/24/2021, MACD is green and going above 0, and its 90% going to break out of the wedge. Also Cathy bought 2o million.
Bullish Bullish Bullish

TWTR just hit KEY level $67, last major resistance before 100Twitter as you know has been a laggard amongst Big Tech.
It may have just found a spark to start to next leg of growth.
Allowing tweeters to receive tips in Bitcoin could be that spark.
$ 67.01 is the KEY resistance fib that was pinged today.
$ 78.29-79.50 is a fib confluence that marked last top.
$ 56.28-56.91 is a MUST hold to maintain uptrend here.
.
I do not use "Fibs" in the "traditional" manner (retracements).
I use Fibs to plot "Ripples" (extensions) created by "Impulses".
Then look for "Confluences" to map the "interference Pattern".
My TV collection of ideas detailing the Concepts:
Chapter 1: Introduction and numerous Examples
Chapter 2: Detailed views and Wave Analysis
Chapter 3: The Dreaded 9.618: Murderer of Moves
Chapter 4: Impulse Redux: Return to Birth place
Chapter 5: Golden Growth: Parabolic Expansions
Chapter 6: Give me a ping Vasili: 'one' Ping only
Chapter 7: The Mighty 2.618: like a Rook in Chess
.

$TWTR Taking Profits and UpdateTaking profits here as Twitter is coming into heavy supply zone. Will re enter long following a breakout , but my bias is to go short at rejection . Wait for confirmation either way.
"You should always want to go long in your current longs, and always go short in your current short positions. If you don't, you should close"

TWTY - going downgoing down to 59 again retesting support line
canceled
retest of bottom trend line
24

$TWTR combogreat combo 13 signal near the 25% entry off of strong impulsive move in Jan. A bit late but I'm going to accumulate shares in any pullback.

TWTR - Trendline Support holdingTWTR retraced back to the long term trendline support last week and once again started to bounce off this support. Plus, there are also a confluence of fibonacci retracements right at this suport: 1) the 38% fib retracement of AB swing and 2) 61.8% fib retracement of CD swing.
It is always a good practice to scale one time frame up (ie from day to weekly chart) to get a clear view of the "bigger picture".
The stop loss is place slightly below the rising trendline at about 57.90.
Expect to scale out partially at 73 and trail the rest up towards 80.
Disclaimer: TA is about improving our odds of a successful trade (not a guarantee). This is just my own analysis and opinion for discussion and is not a trade advice. Kindly do your own due diligence and trade according to your own risk tolerance and don't forget that money management is important! Thank you. Do give me a thumbs up if you agree. Feel free to let me know what you think! :)

$TWTR Daily MACD crossingGood support on Twitter and daily MACD crossing for those that like that indicator, could be a good long idea here. October or November calls or 60/55P credit spread.

TWTR where is the momentum??IN MY OPINION, the momentum is BULLISH! Look for TWTR to finish a strong in 2021!
Fundamentals, 5G mobile and increasingly digital world will drive growth.

TWTR - 200 MA resistance (Bearish)TWTR seems to be struggling at the 200MA. In the past, it tends to look like its getting breaking out from the 200, only to fail a week later.
I think it's doing the same now. Should move lower, hopefully to 55 area. For next week, I bought a 61/59/57 put butterfly for .25.

NYSE: TWTRwhat do you guys see in this Twitter's chart ?
im seeing inverted head n shoulder , a small falling wedge and price rejected around 50% fibonacci retracement
and if you go to weekly timeframe and you can see it rejected on the 50 moving average just on the head ( previous price level ) and the right shoulder (recent one)
let me know what you think , feel free to comment down below .


Twitter Bulls Just Getting Started █ Summary
Taking a look over on the Twitter side of the world, I see several reasons to love this stock at the moment and below I've highlighted the fundamental and technical components that make it a no-brainer to long.
1 — On a technical level, various of the Mid-High TF's are showing strong volume + bullish RSI divergence at this $60.00 level, which is impressive to see.
2 — On a fundamental level, Twitter's monetization of the platform continues to roll out, with ticketed audiences, sponsored spaces and general increase in user activity is going to bring this stock well above the $100 mark alone, which almost makes it too easy to jump into at this $60 range.
Compared to tickers like SNAP or FB, Twitter has surprisingly seen little to no gain in value over the last year RELATIVE to the enormous growth seen by the others - that said, many have written it off without understanding it may just be starting an epic run to catch up to its counterparts in terms of % gain over the next few years.

TWITTER Daily TimeframeSNIPER STRATEGY
This magical strategy works like a clock on almost any charts
Although I have to say it can’t predict pullbacks, so I do not suggest this strategy for leverage trading.
It will not give you the whole wave like any other strategy out there but it will give you huge part of the wave.
The best timeframe for this strategy is Daily, Weekly and Monthly however it can work any timeframe above three minutes.
Start believing in this strategy because it will reward believers with huge profit.
There is a lot more about this strategy.
It can predict and also it can give you almost exact buy or sell time on the spot.
I am developing it even more so stay tuned and start to follow me for more signals and forecasts.

Inverse Head and Shoulders?Long entry level is a break of the neckline, 73.25, with an uptrend.
I am watching for confirmation that the right shoulder has bottomed.
When price breaks the neckline, then somewhere under the neckline is a good stop.
Spinning top at this moment which is a candle of indecision, but is also a bullish harami.
Opposite of the head and shoulders top pattern, the inverse head and shoulders pattern, bottom, occurs after an extended move down. This pattern needs a neckline, which marks resistance, three valleys with the lowest one being the head, and a downtrend at the time it occurs. The right and left shoulders are rarely the exact same price, but does work better if the two are in the same ballpark. The pattern forms as price reaches the neckline and bounces off coming back down to form the 3 valleys. Although the pattern begins taking shape at the right shoulder (RS) it isn’t confirmed until the market closes above neckline resistance. This makes sense as price has not made it through the resistance on several occasions already (o:
Sometimes when in question, always respect resistance. Time can make resistance stronger. False breakouts do occur where price breaks the neckline only to return under it again in a short amount of time (throwback).
This pattern is not valid without a Close above the neckline and a confirmed uptrend. The neckline becomes support and a cautious trader may wait for price to pull back again to the neckline to test the new support level.
No recommendation

If Price Reaches The Demand ZoneThe price has almost created a down trend on the 1 hour frame and it (may) reach the Demand Zone.
If it reaches the demand zone and a clear reversed head & shoulder or double bottom pattern is created inside the zone and the nick line is broken then I see price would jump up to the nearest moving average or swing high.
YOU NEED TO KNOW HOW TO TRADE THE HEAD AND SHOULDER AND DOUBLE TOP PATTERNS, PLUS YOU SHOULD KNOW HOW TO ENTER THE TRADE WITH THE RIGHT RISK MANAGEMENT. OTHERWISE DO NOT ENTER THE TRADE.

Patience is the most important ruleOverall market and news sources are pushing for a market downturn. It takes time to see patterns develop in this market. Patience is going to be tested.
see attached idea from a few months ago.

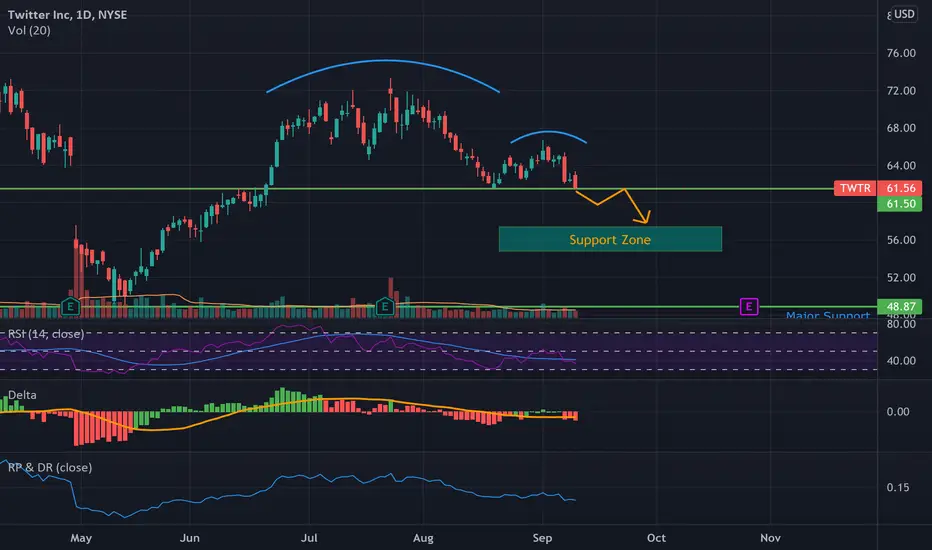
TWTRIs TWTR having a cup and handle pattern? If TWTR actually breaks down it will most likely test the support zone. What are y'all thoughts? Will be see a sell off or will the bulls step in?
Twitter in Long term Decline. Get out your shorts.Short the Twitter around the 62.50
if the downside vol supports comes in.
It could flush.
Long term target about 44.00 Short term
58.oo for a bounce.
Wait for the 200 break and then the pullback to the Trendline.
Namaste Traders

How To Tweet a Chart Image Fast!We realize that sometimes you just want to get your charts out to people as soon as possible.
With the Tweet Chart Image feature, now you can!
As illustrated above, simply choose "Publish" then "Tweet Chart Image" and you'll be able to tweet the image out directly from your Twitter account to get that critical analysis to your followers fast!
What's that? You'd like to do this on your iPhone as well?
No problem, we got you.
Check out what idea users are tweeting right now here
Image Credit

$TWTR Swing PlayWe are close to filling a previous market imbalance, in case we do, here's a swing play that might be of use.
