TWTR trade ideas
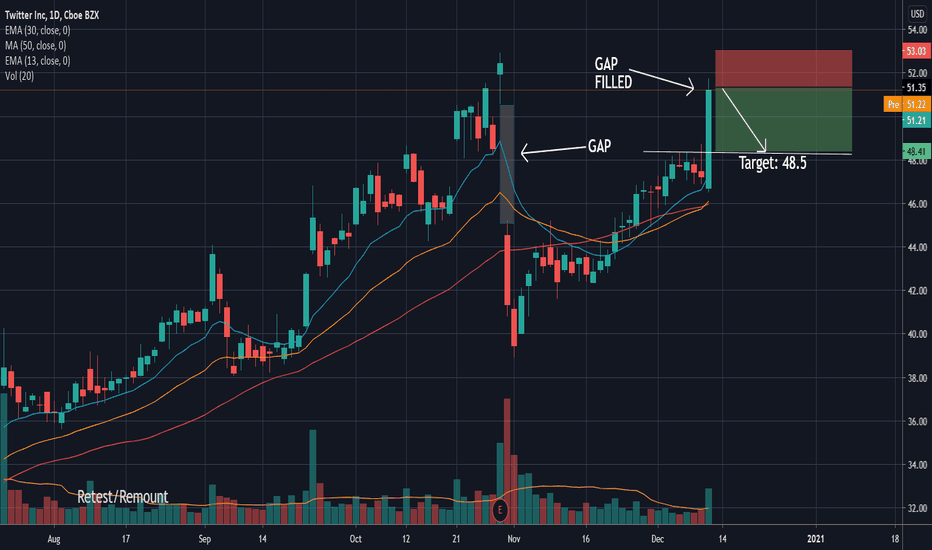
TWTR looking to fill the gapNYSE:TWTR do not sleep on this. Lift off soon. JAN 15 $45 calls will be hot in a couple of week. Grab them now
None of the content published constitutes a recommendation that any particular security, portfolio of securities, transaction or investment strategy is suitable for any specific person. Information provided in this correspondence is intended solely for informational purposes and is in no way guaranteed. For financial advise seek appropriate investment advice from a licensed Industry representative.
$TWTR Bulls Need to break major Pivot at $53 in Twitter
TWTR channel remains well respected , having held under back-test on Friday.
The 7ma may need to catch up for the stock to make its next move higher.
Volume remains impressive.
$53.00 is key Yearly candle Pivot point from 2015 to break.
$56.00 is next target.
$62-64 is of huge importance
Bullish TWTR still cheap, Compared to all the New Shiny UnicornsTWTR has been slow and steady in raising with improved business metrics. It has made an upside move similar to the previous one, however giving its monopoly position (real news in real-time), I would be interested in buying the stock in a pullback to 48.78 a likely small retracment.
For the moment, ATM PCS is a way to go or unbalanced put fly centered around 48. If long already, one can sell call premiums as we approach the top of the previous symmetrical move.
TWTR over 53.89 (Multi-year breakout)Shown here on the monthly view, TWTR is working on a huge breakout. From a fundamental perspective I believe its waiting on news regarding either: 1. Subscription or recurring revenue business model 2. Leadership particularly Jack Dorsey the CEO. I like Jack but he splits his time between $TWTR and $SQ. You have to wonder how this company would be run with a full-time CEO. There have been rumblings about a shift so we'll see what the new year brings. I will be taking a long position with enough time ahead of the news but a breakout over this monthly resistance should yield a big move.
TWTR Long, Demand ZoneIn Uptrend Channel
Earning 10/30, Gap down
Touched support trendline.
Previous Resistance became support
Demand Zone Confirmation
entry 41
stop 38
target 51
Reward:Risk =3:1
I am not a PRO trader. I need few months to practice trading strategies.
If you like this idea, please use SIM/Demo account to try it, until my trading plans get high winning rate.
How to create chart art, infographics, and custom visualsThere are two things you have to master to create the best chart art:
1. The drawing tools available to you
2. Your chart settings
In this video, we show you how to create a blank canvas for chart art, infographics, and custom visuals. The first step to getting started is understanding how you can turn your chart into a blank canvas. Open your chart settings to get started. In your chart settings you can control the look and feel of your chart including the ability to hide everything, even the price line, and draw on an open canvas. You can also control the background, scales, and color of the price line to create something totally unique to you.
The simplest way to create a blank canvas is to uncheck each box in the chart settings and adjust the background color of the chart including the vertical and horizontal grid lines. Once you've created your blank canvas, you have the freedom to create and draw anything you want. You can use this canvas to make flow diagrams, pictures, and more. It's really up to you and your level of creativity. Here are some recent examples that convey interesting educational lessons or trading concepts:
How to manage risk
What is growth investing
How to think about the long term
The trader's journey
The final step to creating the best chart art and custom visuals, is to make sure you master your drawing tools, which are located on the left-side of your chart. You can use them to draw anything that comes to mind. It could be a flow chart, a cartoon or even a picture. You will want to make make the brush tool your best friend. It's how you draw freely across your chart as if you were holding a pen or a paint brush in your hand.
We hope this video tutorial helps you get started and we look forward to seeing the work you create.
Please leave any questions or comments below. In addition you can ask for product features or product requests and we will share them with the team.


