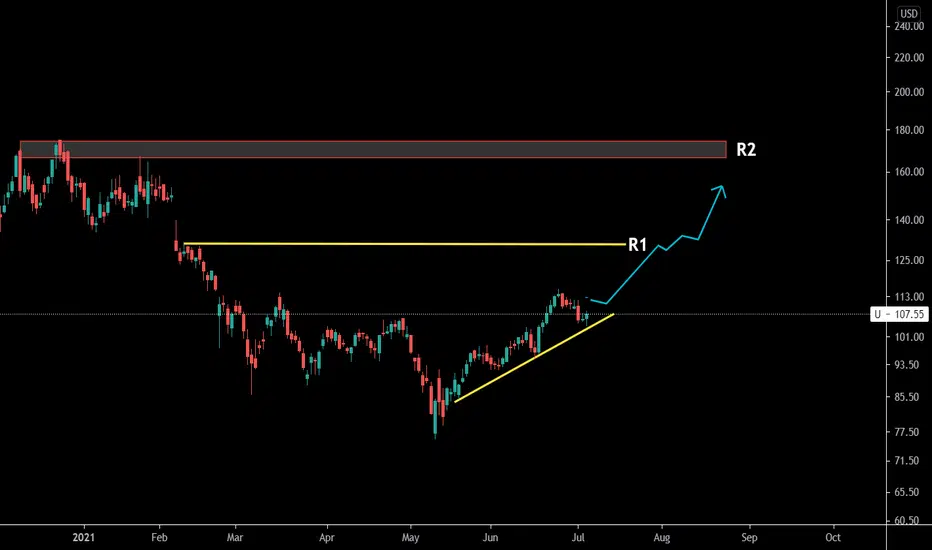
Boxes strategy. $U stock analysis. My plan.Here is my technical analysis of NYSE:U stock using my boxes strategy.
NYSE:U price has broken out of the box recently on great earnings news.
In 2 days it hit a long-term resistance and reversed down.
Price has bounced off of the box ceiling that has become support now.
I see two scenarious for further stock movement.
Scenario #1.
1. Price breaks the long-term resistence level.
2. It comes back to a strong demand zone (preferrably where box level meets the trend line).
3. Then we move higher.
Scenario #2.
1. Price does not break the long-term resistence level.
2. Stock price goes down and misses the demand zone.
3. We continue to move inside the box.
Remember, action at the demand zone of 115.50 is a crucial point to watch.
---------------------------------------------------------------------------------------------------
Disclaimer!!!
This is not financial advise.
U trade ideas

Unity is ready for a huge runAs you can see it just broke from inverse head and shoulders and retested its breakout. This is the most text book bullish chart. Seeing potential run to 155$ soon

$U Unity software, retest of INV H&S Trading opportunityI quite like the look of this setup. After a nice break out of the neckline of the inverted head & shoulders formation - which was accompanied by some decent volume, we have recently seen a retest and hold of this level which also comes in just above the 200dma. I think once can buy this retest between $115-118 ,using a stop loss as a move below the breakout (or 107 if you want to give it some room). Target of the pattern comes in at approximately $151

U trade - take profits if you wantLast update where i gave my trading idea:
Another tech stock where I see a nice entry between 96.03 - 91.34 USD. Targets: 114.22 // 115.53. Then 139.77 gap - 146.59. I´ll play this with some cfd contracts. You can also use options or normal shares. Main target is 91.34 now. Just set an alert if you want to get in;)

Inverse H&S patternInverse H&S pattern
We've got the breakout with very good volume
###NOT FINANCIAL ADVICE###

U possible multy-day breakoutstrong earnings
long consolidatiot at the strong level
buying volume
Looks like a buy at this point

U - LONG
U shares are currently 108 in the aftermarket
Looks interesting over 111
Above 115.5 I would love to increase.
There is no recommendation in the aforesaid 🙊🍒
Anyone who uses this post is at his own risk ✍️

Possible H&S short term.After an amazing +10 move last week to the upside. $Unity seems a bit exhausted. As you can see Unity formed a possible h&S pattern currently sitting right at the neckline.(correct me if i'm wrong).
We had alot of sell off doing FAANG earnings week, let's see how the market reacts .I see a move down to 104.50 - 103.50 area, if it's not able to hold 106.40 as support. Then a continuation to the upside to 115.
Going to keep this short and simple.
Support 1. 106.60
Support 2. 105.66
Support 3. 103. 50
My overall target for Unity is 115
Good luck to everyone next week!!
I am not a financial advisor. Do not take as financial advice, ever.
Do your own research.
Consult a professional investment advisor before making any investment decisions! My ideas are for entertainment only!

UnityFunny double h-a-s patterns - one normal and one inverse. I generaly see it on the rise towards earnings.

U , Long Longed U, 103.94 in with stop under lod . Earnings is coming up shortly and I would like to see 2R out of this to sell half prior to earnings and up stop on remainder . A cushion prior to earnings will be important for me to hold through .


Great setupNYSE:U
Absolutely love this chart. Missed the bottom play on it but still think it has alot of room to move up. Likely double tops for a pullback to trend for some consol.
Will be watching & playing this over the next 4 week.

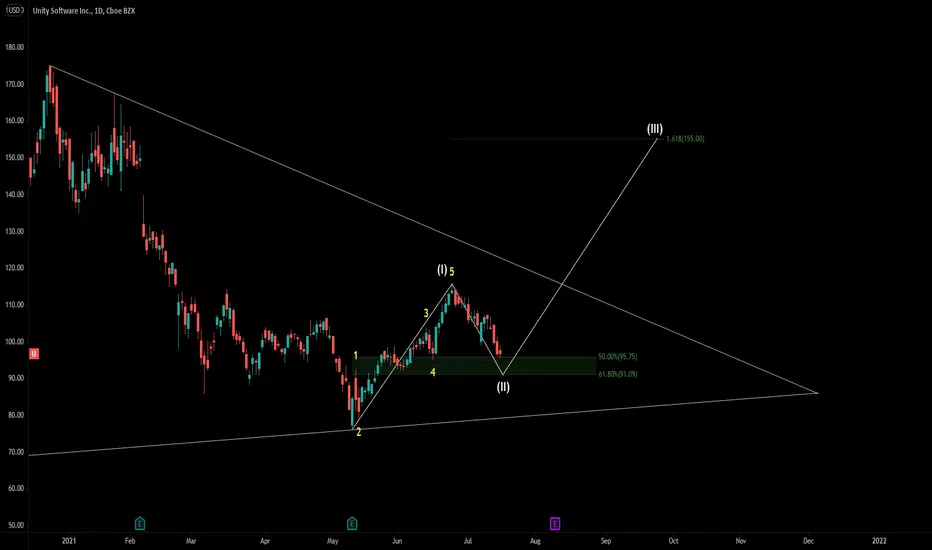
Unity - Long Unity should end wave 2 soon between now and .618 fin zone. I would place my stop loss slightly under this and wave 3 PT would be 155 if we find a bounce within the .618 fib zone.
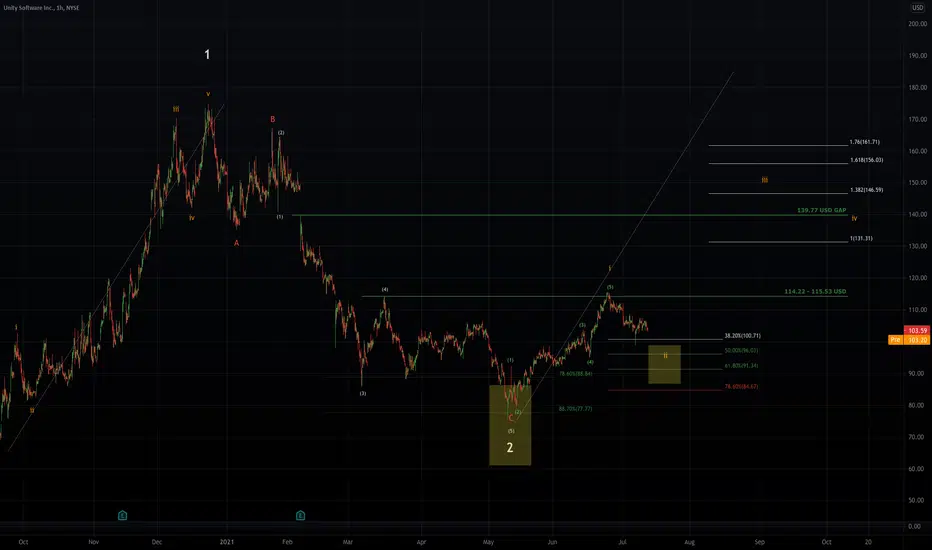
U - trading ideaAnother tech stock where I see a nice entry between 96.03 - 91.34 USD. Targets: 114.22 // 115.53. Then 139.77 gap - 146.59. I´ll play this with some cfd contracts. You can also use options or normal shares. Main target is 91.34 now. Just set an alert if you want to get in;)
Short - back to 75If 97 support breaks, I see further down to 75, and even 65 level. Fasten seat belts, it's going to be fun.

Unity - Dropped hard, Coming Back Strong 💪-Unity was one of the stocks that had the biggest on its stock price during the recent tech recession.
-Now is the time for the come-back! Sit tight and enjoy the rise!
Pull Back FishingAppears to have formed a double bottom and a possible inverse head and shoulders.
Perhaps the bulls do not plan on letting this go much lower
Possible stop under right shoulder.
No recommendation.
Good idea to always look to your left.
IPOs right after their intro can be tough to trade as there is not support below and they can do a free fall on any and every pull back. Later on that important support appears.


U - finished lockup expire selloffU has finished its lockup expire selloff. 5/26 MACD cross up 0. 6/10 20wma cross up 60wma. 6/21 breaks out pivot $105.5.
Next Price Target is $127.5

Unity software - Reverse head and sholder view pointA strong bullish trend has begun on 6/17 with MA 20/60 Golden Cross.
The bearish trend was gone due to the bullish engulfing candles on 6/17.
MA 20/60 Golden Cross occurred and the chart movement is about to test break resistance line with MA 20 /100 Golden Cross.
Trading volume has been steadily supplied to the market. I believe the chart momentum will test the $130 resistance line.

Unity $U formming a "low cheat"I usually have a number of stocks that I like because of the fundamentals, and I just wait for the technicals to do what I like. This time NYSE:U is doing it in a very good way. The price is not yet above its MAs but it has a strong divergence with the MACD and the ADX is below 20 points, all this while formming a "low cheat" which is like a mini "cup & handle" (I learned this reading Mark Minervini).
Normally the "cup & handle" pattern is one of the best reversal patterns, adding this with the other technical signals I think this stock is close to a buy point. Still, for my strategy this setup is high risk. I always wait for confirmation with a second base. IBD has NYSE:U in rank 7 in its industry, and a realtive stength rating of 37; not my usual stock.
The thing adding to my optimism is that breakouts have been working better for the last 2 weeks. I even missed a few stocks because I was being cautious. With this one I would add just half my position size and if it goes my way I'll add my full postion.

