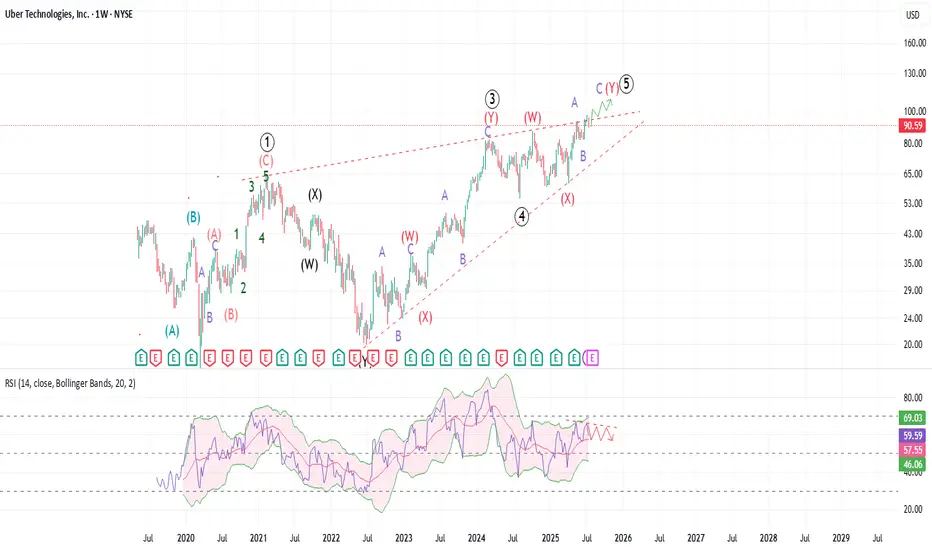
Uber: The end is nigh! Uber is most likely approaching a cycle degree end with a massive leading diagonal structure. The price might get higher than $100 or even close to $150, and it will look like an impulse, but most likely that would a long-term top. Uber is facing maximum pressure from robotaxi competitors and higher
Key facts today
Next report date
—
Report period
—
EPS estimate
—
Revenue estimate
—
5.85 USD
9.86 B USD
43.98 B USD
2.01 B
About Uber Technologies, Inc.
Sector
Industry
CEO
Dara Khosrowshahi
Website
Headquarters
San Francisco
Founded
2009
FIGI
BBG002B04MT8
Uber Technologies, Inc provides a platform that allows users to access transportation and food ordering services. The Company operates through two segments: Core Platform and Other Bets. The Core Platform segment consists of Ridesharing and Uber Eats. The Other bets segment consists of Uber Freight and New Mobility platforms. Ridesharing refers to products that connects consumers with drivers who provide rides in a variety of vehicles, such as cars, auto rickshaws, motorbikes, minibuses and taxis. Its Uber Eats platform allows consumers to search for and discover local restaurants and order meals through online. Its Freight platform creates a transparent and on-demand marketplace that connects shippers and carriers. New Mobility product that provide consumers with access to rides through a variety of modes, including dockless e-bikes and e-scooters.
Related stocks
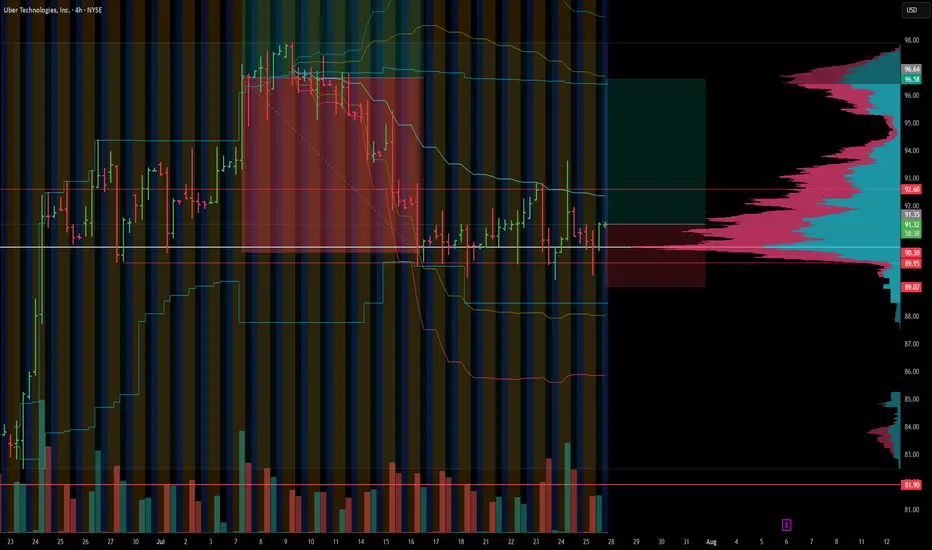
Repeating UBER longUBER has found the support at 91 level and will likely retest initial supply area.
$UBER: Why $UBER Is a Robotaxi WinnerUber is on the verge of a major transformation, with robotaxis set to become a game-changing profit engine.
Technical charts indicate we can enter a long position today with low risk, while aiming for a long term rally resumption from here. Monthly and quarterly timeframe Time@Mode trends are bull

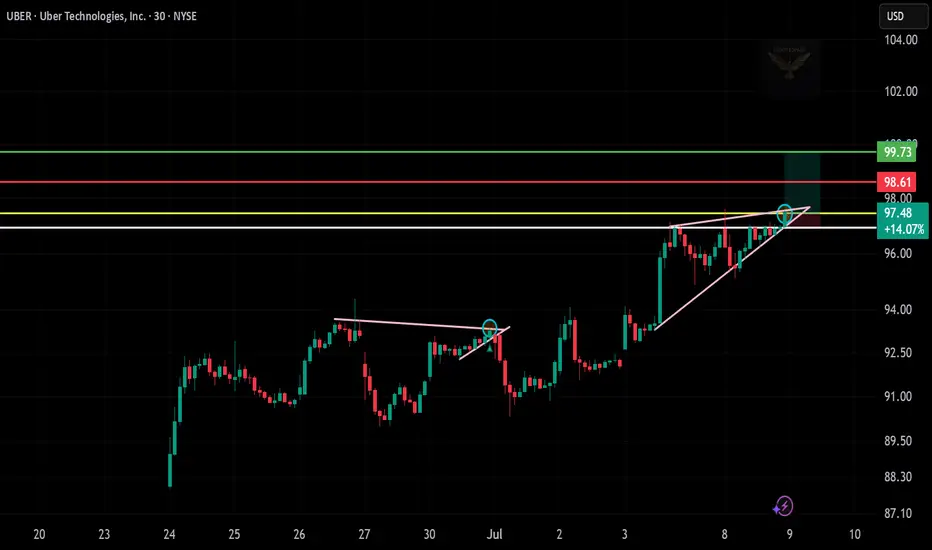
Long Trade Description (UBER | Uber Technologies Inc.)📄
Ticker: NYSE:UBER
Timeframe: 30-Minute Chart
Trade Type: Long – Ascending Triangle Breakout
UBER is forming a strong ascending triangle near resistance, with bullish momentum and clean structure. Entry is taken around $97.48, anticipating a breakout above the horizontal level. Target is set at
UBER longBroken long term resistance, retested, and once again pushed 20 day Donchian Channel.
Turtles are coming out of their shells taking UBER to the new ATHs.
Long term hold.


UBER · Daily — “Channel-Break” Idea Toward $110 → $125Why I Like the Setup
Secular Up-Channel: Since mid-2023 price has respected a textbook rising channel (~$30 tall).
Fresh Breakout Attempt: UBER is now pressing the upper rail near $100. A daily close above it would signal a new expansion phase.
Measured-Move Math: Projecting the channel’s height f

Uber’s Path to $95+Uber Technologies (UBER) is positioning itself for long-term growth by expanding beyond its core ride-hailing and delivery businesses into advertising, travel, service partnerships, and autonomous vehicle (AV) technology. These strategic moves aim to diversify revenue streams and enhance operational

UBER long-term gemOn the monthly chart, Uber broke out from a massive ascending triangle and successfully retested the upper resistance, flipping it into support. You’re not ready for what’s coming!

UBER Breakout Alert!
Breaking above resistance with rising support — eyes on $95.75 🎯
Entry: $93.28 | SL: $92.70 | TP: $95.75
📈 Bullish momentum in play.
#UBER #BreakoutTrade #StockTrading #BullishSetup #ProfittoPath

See all ideas
Summarizing what the indicators are suggesting.
Neutral
SellBuy
Strong sellStrong buy
Strong sellSellNeutralBuyStrong buy
Neutral
SellBuy
Strong sellStrong buy
Strong sellSellNeutralBuyStrong buy
Neutral
SellBuy
Strong sellStrong buy
Strong sellSellNeutralBuyStrong buy
An aggregate view of professional's ratings.
Neutral
SellBuy
Strong sellStrong buy
Strong sellSellNeutralBuyStrong buy
Neutral
SellBuy
Strong sellStrong buy
Strong sellSellNeutralBuyStrong buy
Neutral
SellBuy
Strong sellStrong buy
Strong sellSellNeutralBuyStrong buy
Displays a symbol's price movements over previous years to identify recurring trends.
UBRT4884099
Uber Technologies, Inc. 7.5% 15-SEP-2027Yield to maturity
7.11%
Maturity date
Sep 15, 2027
USU9029YAF7
UBER TECHNO. 20/28 REGSYield to maturity
6.09%
Maturity date
Jan 15, 2028
UBRT5886387
Uber Technologies, Inc. 5.35% 15-SEP-2054Yield to maturity
6.01%
Maturity date
Sep 15, 2054
UBRT5886385
Uber Technologies, Inc. 4.8% 15-SEP-2034Yield to maturity
5.08%
Maturity date
Sep 15, 2034
USU9029YAG5
UBER TECHNO. 21/29 REGSYield to maturity
4.84%
Maturity date
Aug 15, 2029
UBRT5886386
Uber Technologies, Inc. 4.3% 15-JAN-2030Yield to maturity
4.46%
Maturity date
Jan 15, 2030
UBRT6077245
Uber Technologies, Inc. 0.0% 15-MAY-2028Yield to maturity
−5.01%
Maturity date
May 15, 2028
UBRT5706997
Uber Technologies, Inc. 0.875% 01-DEC-2028Yield to maturity
−7.87%
Maturity date
Dec 1, 2028
UBRT5323752
Uber Technologies, Inc. 0.0% 15-DEC-2025Yield to maturity
−36.24%
Maturity date
Dec 15, 2025
See all UBER bonds
Curated watchlists where UBER is featured.


Frequently Asked Questions
The current price of UBER is 91.29 USD — it has increased by 0.46% in the past 24 hours. Watch Uber Technologies, Inc. stock price performance more closely on the chart.
Depending on the exchange, the stock ticker may vary. For instance, on NYSE exchange Uber Technologies, Inc. stocks are traded under the ticker UBER.
UBER stock has risen by 0.54% compared to the previous week, the month change is a −0.30% fall, over the last year Uber Technologies, Inc. has showed a 38.32% increase.
We've gathered analysts' opinions on Uber Technologies, Inc. future price: according to them, UBER price has a max estimate of 120.00 USD and a min estimate of 76.00 USD. Watch UBER chart and read a more detailed Uber Technologies, Inc. stock forecast: see what analysts think of Uber Technologies, Inc. and suggest that you do with its stocks.
UBER reached its all-time high on Jul 9, 2025 with the price of 97.72 USD, and its all-time low was 13.71 USD and was reached on Mar 18, 2020. View more price dynamics on UBER chart.
See other stocks reaching their highest and lowest prices.
See other stocks reaching their highest and lowest prices.
UBER stock is 2.10% volatile and has beta coefficient of 1.23. Track Uber Technologies, Inc. stock price on the chart and check out the list of the most volatile stocks — is Uber Technologies, Inc. there?
Today Uber Technologies, Inc. has the market capitalization of 190.90 B, it has decreased by −5.86% over the last week.
Yes, you can track Uber Technologies, Inc. financials in yearly and quarterly reports right on TradingView.
Uber Technologies, Inc. is going to release the next earnings report on Aug 6, 2025. Keep track of upcoming events with our Earnings Calendar.
UBER earnings for the last quarter are 0.83 USD per share, whereas the estimation was 0.51 USD resulting in a 63.53% surprise. The estimated earnings for the next quarter are 0.63 USD per share. See more details about Uber Technologies, Inc. earnings.
Uber Technologies, Inc. revenue for the last quarter amounts to 11.53 B USD, despite the estimated figure of 11.63 B USD. In the next quarter, revenue is expected to reach 12.47 B USD.
UBER net income for the last quarter is 1.78 B USD, while the quarter before that showed 6.88 B USD of net income which accounts for −74.20% change. Track more Uber Technologies, Inc. financial stats to get the full picture.
No, UBER doesn't pay any dividends to its shareholders. But don't worry, we've prepared a list of high-dividend stocks for you.
As of Jul 26, 2025, the company has 31.1 K employees. See our rating of the largest employees — is Uber Technologies, Inc. on this list?
EBITDA measures a company's operating performance, its growth signifies an improvement in the efficiency of a company. Uber Technologies, Inc. EBITDA is 5.24 B USD, and current EBITDA margin is 10.71%. See more stats in Uber Technologies, Inc. financial statements.
Like other stocks, UBER shares are traded on stock exchanges, e.g. Nasdaq, Nyse, Euronext, and the easiest way to buy them is through an online stock broker. To do this, you need to open an account and follow a broker's procedures, then start trading. You can trade Uber Technologies, Inc. stock right from TradingView charts — choose your broker and connect to your account.
Investing in stocks requires a comprehensive research: you should carefully study all the available data, e.g. company's financials, related news, and its technical analysis. So Uber Technologies, Inc. technincal analysis shows the buy rating today, and its 1 week rating is buy. Since market conditions are prone to changes, it's worth looking a bit further into the future — according to the 1 month rating Uber Technologies, Inc. stock shows the buy signal. See more of Uber Technologies, Inc. technicals for a more comprehensive analysis.
If you're still not sure, try looking for inspiration in our curated watchlists.
If you're still not sure, try looking for inspiration in our curated watchlists.