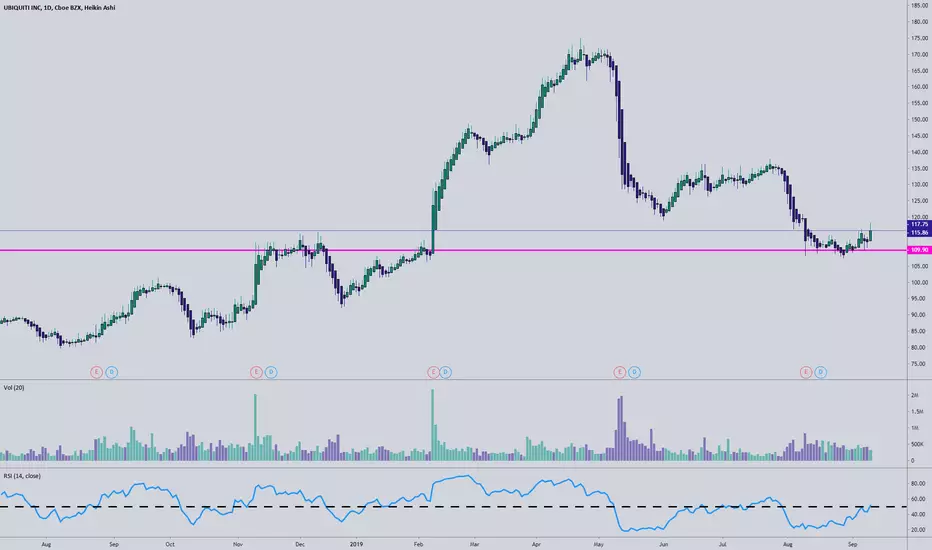
Trading JournalUI was leading as market was showing signs of weakness by going sideways. Brokeout just before market turned around and made all time high.
Reason for selling, stalling action, plus need to reduce exposure and make room for other trades.
Could be last breakout as stock has gone continuously up from $100x to $400 and didn't even close below 21 ema
UI trade ideas

$UI looking to drop $UI, huge ABC pattern confirmed. Price target will be below 188.46. During Earning report season options will be heavily inflated. If you’d like to minimize your risk exposure you may sell a vertical call.
$10 spread
STO $165C
BTO $175C
Your risk exposure should be $.50ish per position for $10.00.

$UI Ubiquiti Inc Breakout Pt's
Hopefully you find the chart helpful in terms of Supports & Resistance etc.
we refrain from adding commentary on the chart as that is reserved for our members and we are very conscious of not giving financial or trading advice.
Thank you for taking time to consult our chart and we would really appreciate a like, follow or comment.

UI (Ubiquiti Inc.) - Change in trend, bullish startUbiquiti Inc. provides wireless networking products and solutions. The Company offers radios, antennas and management tools for wireless networking and other applications in the unlicensed radio frequency. Ubiquiti Inc., formerly known as Ubiquiti Networks Inc., is based in New York, United States.
Strong EPS and Sales Quarter-on Quarter
Heiken Ashi, HullMA and MACD indicators all showing potential for start of bullish trend.
Target 1 set, if price met apply trailing stoploss to T2.
Please remember to 'LIKE' and comment.
DO your own research, and good luck!


UIIn my experience, 8 out of 10 alerts for lawsuits of almost any type in companies with good market capitalization, are only opportunities and obviously market corrections. Ubiquiti has always had good fundamentals. I had just opened a position, I hope I am not wrong, but nothing is certain in this game.

UI breakout which I playedA lone star in a piece of (poop) market. Low float, strong growth and relatively unknown name. Keep tabs on this.
Positions: 50 shares @320.24 average, cut 50 for profit today at 390.


$UIEntry price : 248.03
Fundamentals :
- Sector: Telecom
- EPS % Chg (Last Qtr): 72%
- 3 Year EPS Growth Rate: 29%
- EPS Est % Chg (Current Yr): 32%
- Sales % Chg (Last Qtr): 46%
- 3-Year Sales Growth Rate: 14%
- Annual Pre -Tax Margin: 35.7%

UI, MACD Histogram just turned positiveThis is a Bullish indicator signaling UI's price could rise from here. Traders may explore going long the stock or buying call options. Tickeron's A.I. dvisor identified 42 similar cases where UI's MACD histogram became positive, and 37 of them led to successful outcomes. Odds of Success: 88%. Current price $275.44 is above $194.83 the highest resistance line found by Tickeron A.I. Throughout the month of 11/19/20 - 12/22/20, the price experienced a +15% Uptrend. During the week of 12/15/20 - 12/22/20, the stock enjoyed a +9% Uptrend growth.
Bullish Trend Analysis
The Momentum Indicator moved above the 0 level on December 03, 2020. You may want to consider a long position or call options on UI as a result. Tickeron A.I. detected that in 62 of 80 past instances where the momentum indicator moved above 0, the stock continued to climb. The odds of a continued upward trend are 77%.
UI moved above its 50-day Moving Average on October 05, 2020 date and that indicates a change from a downward trend to an upward trend.
The 10-day Moving Average for UI crossed bullishly above the 50-day moving average on October 12, 2020. This indicates that the trend has shifted higher and could be considered a buy signal. Tickeron A.I. detected that in 10 of 15 past instances when the 10-day crossed above the 50-day, the stock continued to move higher over the following month. The odds of a continued upward trend are 67%.
Following a +2.92% 3-day Advance, the price is estimated to grow further. Considering data from situations where UI advanced for three days, in 260 of 349 cases, the price rose further within the following month. The odds of a continued upward trend are 74%.
The Aroon Indicator entered an Uptrend today. Tickeron A.I. detected that in 211 of 330 cases where UI Aroon's Indicator entered an Uptrend, the price rose further within the following month. The odds of a continued Uptrend are 64%.

$UI with a slight bullish outlook after earnings$UI is projected to have a slight bullish outlook after a Positive under reaction following its earnings putting the stock in Drift A with the price currently trading between the median line and the Upper boundary of the projected PEAD cone.
If you would like to see the Drift for another stock please message us. Also click on the Like Button if this was useful and follow us or join us.


UI is making flag. Price to go down to $128.09UI is making flag. Price to go down to next support $128.09

Alex Vieira Downgrades Ubiquiti Networks to Junk $198Alex Vieira Downgrades Ubiquiti Networks to Junk $198. This company changed ticker past UBNT to UI.


AI Trading Vision Forecast Ubiquiti Share Price CrashBoth ideas were made available on video at $52 and $175
