V trade ideas


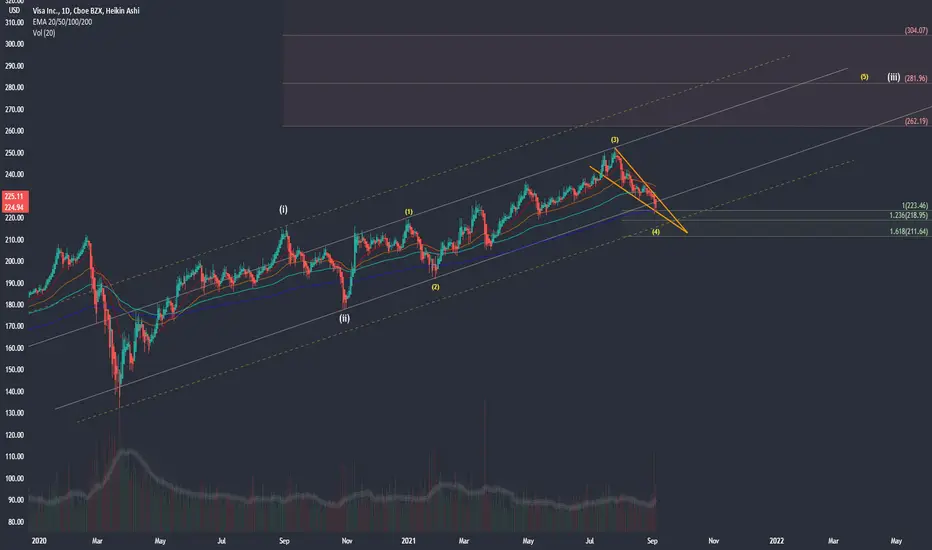
VISA - WAITING FOR BUY SIGNAL#VISA gave us a nice pullback here in minor wave 4 and now I am waiting for the buy signal for completion of minor wave 5 and major wave 3. We can see in the chart that we typically get a small bounce off the 200 EMA but in the past, they have pulled this below 200 EMA only to jerk it back up. Green box is my buyzone inside this falling wedge. Awaiting buy signal using volume candles and fib levels provided.
Visa Bounce$V had a minor bounce today at this AVWAP/fib level today. Inside day. Could be a reversal point.


Visa, buy the dipVisa is converging on multiple support areas, including the trend line, 200ma, and support line. RSI has always respected the 30 area for the past year, along with the MACD respecting support. CMF is also in an uptrend which should give us a bounce soon. Long 11/19, 230c; shown on large sweep orders as well. Look for a new ATH in October if markets comply.

V could hit $250 by mid NovemberIf the symmetry plays out as previous occasions on the weekly chart, we should see V hit $250 price target by mid-November.

$V support confirmed yesterday #visa great support confirmed yesterday at visa
green day today and here!
disclaimer

What to look for (Visa)There are some notable bull signs that can be seen on Visa. One of them is a close above the swing low. Another bull signs is the reducing selling momentum + Willy Oscillator. Another bull sign I want to brief on is the Weis Wave. The weis wave is indicating that there is less interest on the short side of Visa. I'm personally awaiting a shift in the weis wave to confirm that we are consistently getting less interest towards the short side and will then execute long positions on this stock, but I believe the probabilities are stacked in the favor of longs.
Bullish Signals
-Squeeze indicator
-Willy Oscillator
-Weis Wave
-Fib Support
▼Side Note▼
-On the 15 min Chart we were given a sell signal. This may potentially allow for dips to catch if it is followed by reduced momentum.

Payment Processors Are Setting Up To Get REKTMany of the payment processors and banks i look at seems to have some sort of indication that it will be going down soon Visa is just one of many. Today will be the closing of the month for VISA and many others and like many others Visa will be bearishly engulfing on the monthly and breaking down a rising wedge.

$V Weekly Technicals and FundamentalsTechnicals :
Respecting Anchored VWAP at $230 and also 21MA & volume shelf as support. Trading the bottom of upward channel with historic strong bounces (black arrows). Also uptick in RSI and bullish trend in OBV indicator.
The above indicates a move up, however a break below we could see 218.12 or the 50MA as next line of support
Fundamentals:
Visa’s earnings of $1.49 per share, outpaced the Zacks Consensus Estimate by 12%. The bottom line improved 41% year over year. Next quarter's EPS est $1.54
The company’s net revenues advanced 27% year over year to $6.1 billion in the quarter under review. The top line beat the consensus mark by 5.1%.
I'm bullish with 10/15 $240C

V MTF ANALYSIS Looking for a confluencw of crypto adoption, overdrive of E-commerce expansion & Oct earnings. NO TP TUTES WILL SHOW YOU

VISA: Trading in a upward channelPossible bounce from the minor support which stacked up with the channel. Apply stop loss and take profit to all your trade. SL & TP are available for free in the group.


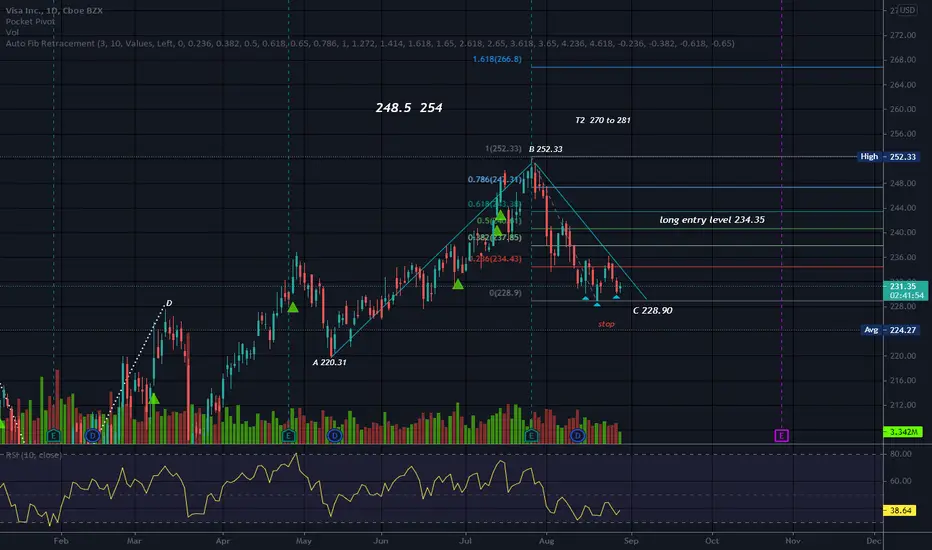
ABC BullishThe target would be D. This is a correction pattern and is very common. Sometimes it can be an AB=CD in which the AB leg equals the CD leg and you can use the magnet to move the AB leg and project it from C. The targets can also be a bit shorter than the AB leg or an extension of the AB leg. Targets are calculated using fib levels. I use the .382, .618 and .786. For targets 2, I use the 1.272 and the 1.618 but realizing not every security reaches targets 2, some do reach every price level in targets 1. I use my gut on that one. Sometimes I am happy to reach the first target (o: and focus on targets 1 as for many securities targets 2 are down the road and may not ever get here depending on the security and the bullishness or bearishness surrounding the market. There are possibly other ways to calculate targets and we are all different.
When I eyeballed this the BC leg appeared a bit short in comparison to the AB leg. The Auto Fib Retracement tool on here can help nail down C. Retests of C are common. Any pattern can fail and price can go below C. If it goes too far below C, the ABC pattern has failed, so I wait for a double bottom, or another harmonic pattern to form. ABC bullish is a harmonic pattern as it is part of an ABCD pattern, just D is not here yet (o:
Long entry level is a level one chooses that is over immediate resistance, and is also a level where algorithmic/computer trading may kick in as these are programmed to buy at certain levels. Sometimes you will even see a gap up when this happens. Ideally, long entry level or above is where you enter the trade. Long entry level is subjective and you may see another level. I have entered early before, before long entry level and paid the price for doing so. My money was tied up in a security that was not moving and even moving down. Sometimes entering closer to C or near the handle low of a cup pattern can pay off. Sometimes not. It is not fun, and it is not financially lucrative to go in the hole while you wait on price to finally move. Patience can be a virtue.
No recommendation and V is not to long entry level (o:
If a security gets to be too much of a pain and causing me stress, then there are plenty of other securities to choose from (o: I have found that getting too focused on a certain name can screw me sometimes. If price is already out the roof and even arcing, I try to say to myself "Laura, you missed that one" and move on to the next one.
This one is close to support. Any pattern and any level of support can fail.
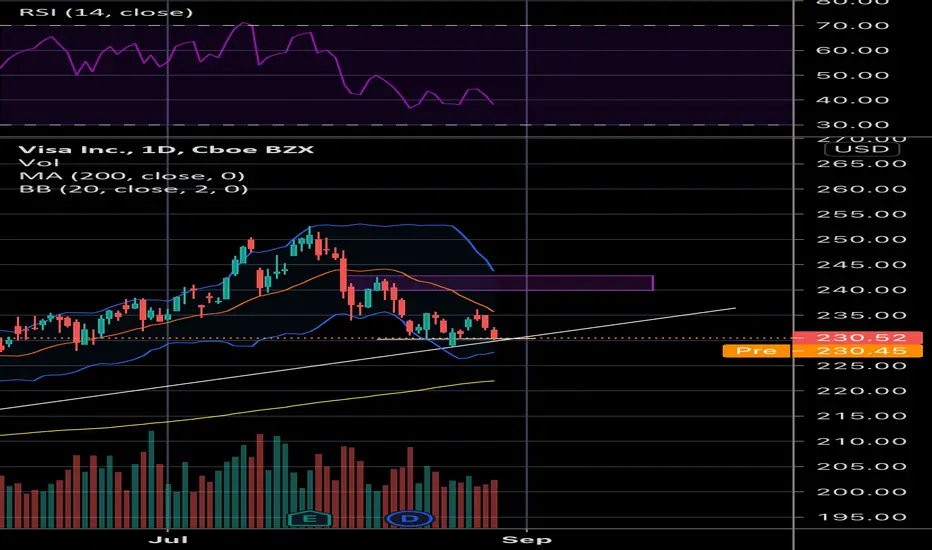
Bullish Divergence + Double bottom on VSigns:
Above big trend line dating back dating back to May 2020 (retest)
Double bottom on the support line
Bullish divergence on the MFI/RSI on 4H
Bullish divergence on MACD
Huge V 240c 10/15 flow a few weeks back
This could run. PT1: 240, PT2: 250 PT3: 255

Possible double bottom on visaThe down trend on visa looks to be ending.
Waiting for it to break bullish.
A long term position of mine.
Down from 250.
First major resistance is around ~240.
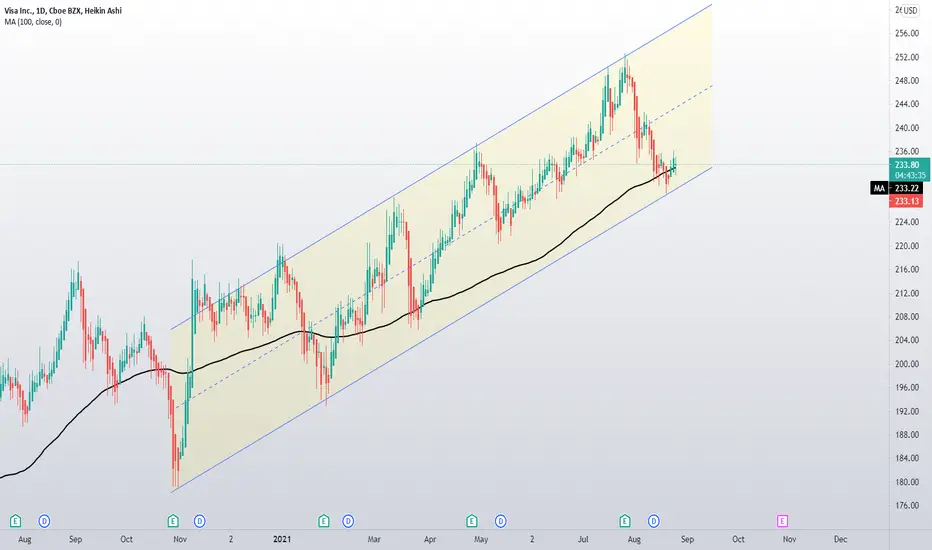
$V Trading the ChannelRemoving some indicators to eliminate some noise.
Break out of channel invalidates trade, looking for a move to middle of channel
Entered 10/15 240 Call and 230/225P bull credit spread

TrendyTrades: V with 3PTSI'm bullish on VISA with 3 pts displayed to take profits. Above anchored vwap and break of downtrend. Lets gooo.

$V - Falling wedge breakout daily, calls above 234.5$V - Visa - Falling wedge breakout daily, watch for call above 234.5

Inside the ascending channel on VisaToday we will analyze the current chart of Visa. Let's start:
a) The main two structures we can see on the chart are: The ascending channel and the dynamic support resistance level (yellow lines)
b) Currently, the price is above the dynamic support resistance level and is supported on the ascending channel
c) At the moment, we have a corrective pattern (green structure), and we say "at the moment" because the pray may keep falling and invalidates the whole idea. Yes, that's trading (what a lonely world)
d) Ok, let's keep going. What we can see here is that if the price breaks above the green horizontal line, we will take that as a confirmation of the bullish view towards the two fibo extensions levels.
e) Invalidation level is always below the structure (assuming that the price reaches the entry-level and then start falling)
f) If everything goes as expected, we can wait for a 90 - 120 days movement towards the target
Thanks for reading! And remember: Protect your Capital!
