VISA INCNYSE:V
Hey, traders.
We are in the middle of a market correction.
The market's standing in the range.
SPY has the upper level of the channel limited by resistance lines at 313.1, the lower level of the channel is 298.8
If we will break the lower level, we will get a possible fall in the area of 280.
It is hard to say whether the market will be supported or not. I would not bet on buying any time soon.
The market is under pressure from several factors: the virus, Biden's leadership and industry issues for banks and social media companies.
The Dow Jones Industrial Average (-2.8%), Nasdaq Composite (-2.6%) and Russell 2000 (-2.4%) also fell by more than 2.0%.
All 11 sectors of the S&P 500 closed in the negative zone.
The banks were pressured by the Fed's decision to require them to suspend the share buyback and dividend caps in the third quarter.
Also from the negative news is the reluctance of many companies to place their advertising on the FB. Naturally, the company's shares were marked by decline.
This week, we will look at reports on consumer confidence and the number of jobs.
I expect a storm from the volotilities, especially since this working week in the US will be short.
So, in the end, the summary for the beginning of the week: I expect the market to fall. I'm very cautious about longs. I will give priority to short signals.
When trading inside the day, we pay special attention to the SPY behavior.
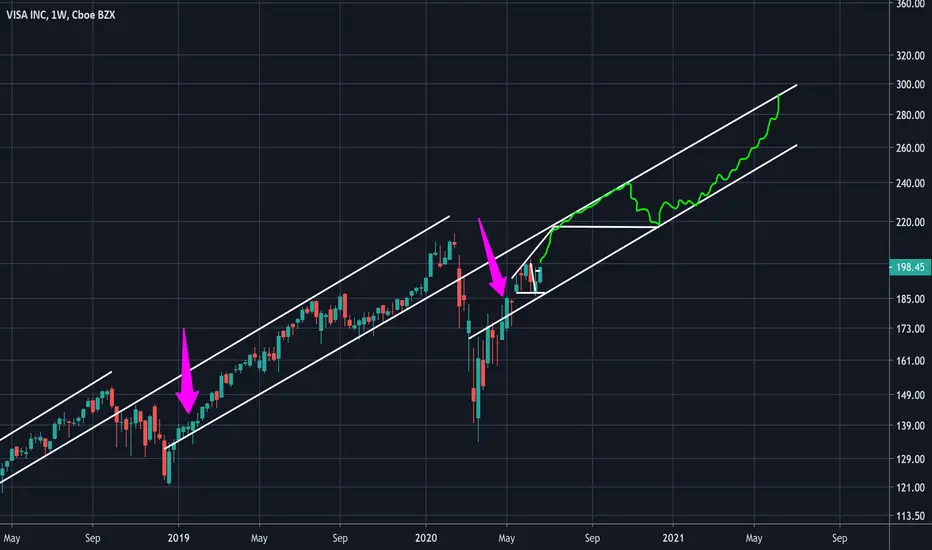
Now lets see the Visa. This is first candidate to short.
What we see on the chart:
1. A strong mirror level, formed back in December 2019.
2. The resistance level has become a support level.
3. From May 18th to June 9th, we were going up, however we could not consolidate above 200. The strong short player dropped the price to the support level.
4. On the 11th, 12th, 13th and 25th the shorts player tried to break through this level.
5. We are watching a series of retests.
6. The last trading session was closed under the low
7. You can see that the short player has gained position. I expect a break-down level.
I recommend to enter the short strictly according to your trading strategy.
V trade ideas


I recommend buying again Will return to rise in the coming days
Technical indicators indicate that Visa INC , will rise in the coming days

Visa, making a charge up $VStrong trend with MACD heading up from zero line. Price above MA's and strong Williams R.

Price near a cluster of MAsPrice near MA 200, MA 100 and MA 50. Fib retracement 61.8 also near. Good to go long at market with initial target @ 200.00
Cancel trade if proce closes below 180.00
Not trading advice, just personal analysis.

SuperTrail Indicator and how I use it.The SuperTrail indicator is similar to the very popular and widely used SuperTrend but it has been improved to use a percentage value instead that helps users to determine the natural trading range of a stock over a period of time, and set stop losses (especially trailing stops) accordingly.
The best way to use it is to find stocks in a steady trend (upwards if you are going long or downwards if you are going short) and keep changing the indicator percentage levels until you identify a percentage that keeps you in the trade for longer without getting stopped out too often. You can then set this value in your trading program, or set an alert within Trading View to notify you if something changes and you need to take an action.
Some stocks might have little volatility and only require an 8% trail. Some might be more volatile and work better with a wider 20% trail. It also depends on your time frame. Shorter time frames are typically shorter stops. Longer time frames work better with wider stop values. The best thing about this tool is that it helps you identify the best optimised stop loss range to set for each individual stock based on its range.
The indicator works on any time frame - minutes to hours to weeks. If you want to hold stocks for a shorter time you might look at the natural range over the last 7 days, medium term the range over the last 3 months, or if you want to hold a stock for a much longer period of time then perhaps look to identify the range over the last 12 months. If you get stopped out of a stock you like, then set an alert, and when the stock moves back up within its range you can decide on whether or not you re-enter.
It is a super simple indicator. As always it is meant only as a visual guide to assist you with your trading. You can check out my Trading View channel to see how I have used it across different stocks and based it on different time periods.


Very possible movement for Visa Inc.Visa is inside a triangle and it formed a cup and handle pattern. Analysing its moviment we can see a strong resistance, so it might break the support. This idea is very similar to Bank of America (BAC).
Follow me for updates and more ideas!


visa daily analysisHi friends
the graph of this market shows with a very high probability an upward trend still 214.34 with the vigilance of market reversal

visa inc analysis in 15 minvisa card chart will go down agine but for short time so sell for short time

Visa ShortNYSE:V
Rising Wedge has broken through the support line today. Possible bearish price movement forecast for the 2~3 weeks.
Happy Friday!

VISA INC chart analysis:On one day chart price is forming new high on the peak.
Below 186.36 confirm bearish.
The price has Strong internal support 186.36 near this level.
The volume declining but though, it has more volume then normal.
As it has a support price can move up.
If the price cross the 202.34 level it can still further move up-to 208.54


V - trading 30 min and daily chart - CALLSRSI is back over 50 on 30min chart and if daily RSI holds here (and moves higher) the price will get back up to 195 at least.


V (Visa Long - but not now)Too much volume in the 140-142 areas. But you can definitely long at 140-142.

VISA hit 200 milestone. VISA is trending nicely.
Hit and react positively to each support and resistance.
Price move above EMA10, FiFT still +ve, ATOM nicely trend.
Hold and further buy upon retest 200.


V - price is under support line for second time - swing putsPrice went under the line in mid-May, and now again it broke support and is retesting it today. I bought Jun 19 puts, 195 expiry.
