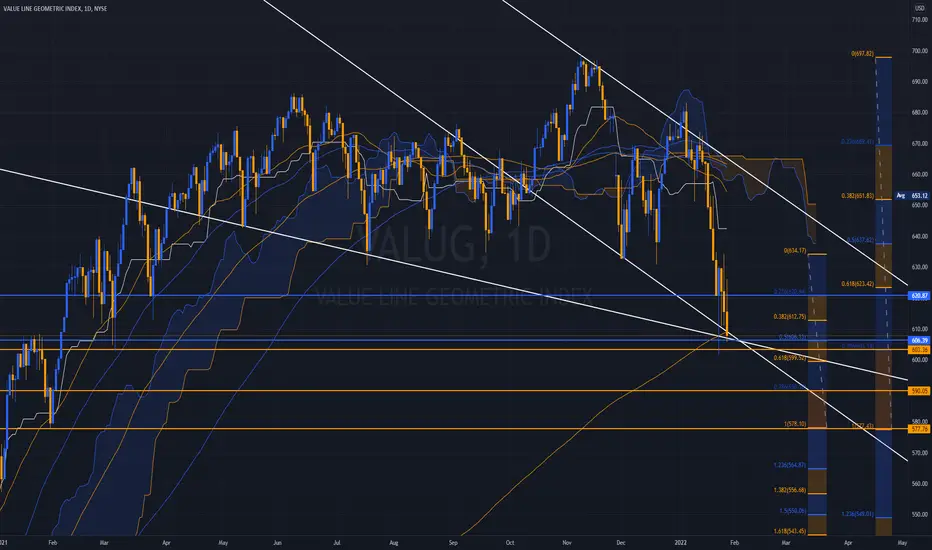
Average US Stock Rebounds as VIX Dies – But Who's Really WinningThe Value Line Geometric Index ( NYSE:VALUG ), representing the average US stock, has bounced hard off multi-year support, right as Trump makes global headlines for striking billion-dollar “deals” in the Middle East.
But let’s call this what it is:
Deregulation for aircraft, crypto, energy 🛩️💸⚡
T
Related indices

Prediction for global marketsVALUG loves double tops and levels. Having failed to retest the highs, this appears to be a failed break like the last one, which saw a breakdown of previous support at least.

THE SHORT SQUEEZE as STARTED PEAK ON JAN 112024The chart posted is my top view I am posting the weekly and daily of the value line For a reason it should NOT break the low of oct 27th 2023 If it is valid I have a major spiral from sept 21 2001 it is due NOW 11/10-13th the march 13th low was from june low 1949 . We will see rather s

The TOP wave count THE SHORT SQUEEZE HAS STARTEDThe chart posted is MY top wave count This is a major WARNING to being short is a highest risk in a few years . The spiral turn due is from sept 21 2001 Low The market rallied over 24 % gain in less that 62 days That last low was in a word Perfect in its relationships within the fib . I

Value line geometric updated with multitimeframe sector analysisTo follow up on the previous post, added a snapshot of multi-timeframe US sector analysis
NYSE:VALUG AMEX:IWM AMEX:SPY NASDAQ:QQQ AMEX:DIA
Data as of September 22, 2023

My approach. Market Weather - Sept 22, 2023Many studies show that passive is superior to the active investment approach, and I agree that most money should be managed passively, using low cost broadly diversified index funds. Markets are mostly efficient in pricing securities, meaning there are not many proverbial 20-dollar bills you can fin

Broadening Top for U.S. Stocks (VALUG)One valuable yet overlooked, a tool for gaining insight into the market is the Value Line Geometric Index (VALUG).
VALUG index contains a mix of roughly 1,700 stocks from the major North American market indexes.
It is equal-weighted, uses a geometric average, and has a daily change closest to the

VALUELINE THE REAL CRASH IS MONTHS AWAY The chart posted is a great one so as to understand what still lies ahead WE ARE NOW CLOSE TO WHAT THE DEC FORECAST called for after a 13 yr Fake { FED Balance sheet} Bull market in assets . The avg decline over the last 120 years is 35 % peak to low .I said avg this one will look more

WXY: double zigzagAt first, this looks like an expanding diagonal, which it is. But the internals are that of double zigzag.

Value Line Geometric Index / Balanced WeightingWell, that took a decisive turn for the worst in a short period of time.
In Indicating the VLGI would lead the ES... it dragged the ES by its nose
to new lows for the move quickly.
A song of broad weakness within the Complex.
_______________________________________________________________
Nothi
See all ideas
Displays a symbol's price movements over previous years to identify recurring trends.