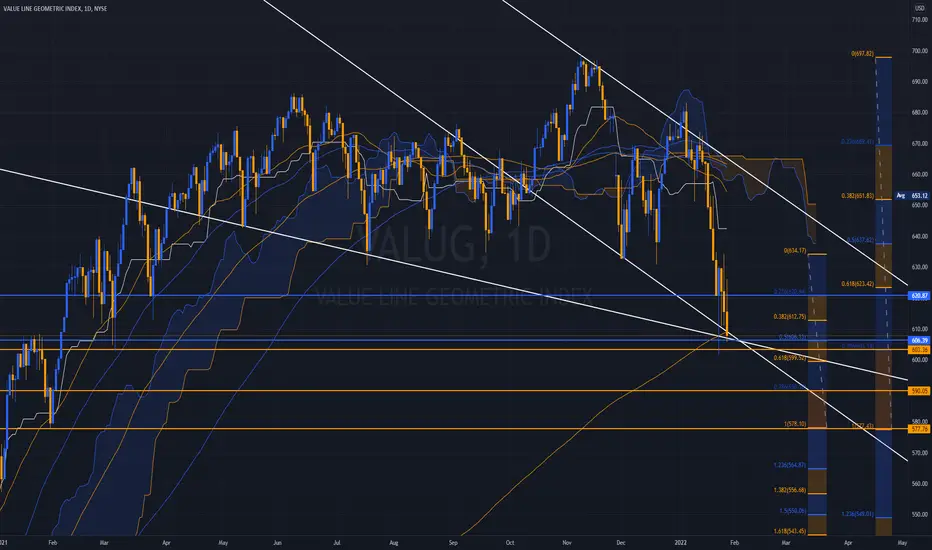
Average US Stock Rebounds as VIX Dies – But Who's Really WinningThe Value Line Geometric Index ( NYSE:VALUG ), representing the average US stock, has bounced hard off multi-year support, right as Trump makes global headlines for striking billion-dollar “deals” in the Middle East.
But let’s call this what it is:
Deregulation for aircraft, crypto, energy 🛩️💸⚡
Tariffs and restrictions on retail, green tech, and small business 🏪🌱📉
And all while sitting on personal meme coin bags worth billions.
Meanwhile, volatility ( TVC:VIX ) is back to sleep, and main street stocks are climbing — but who is actually winning here?
VALUG trade ideas

Prediction for global marketsVALUG loves double tops and levels. Having failed to retest the highs, this appears to be a failed break like the last one, which saw a breakdown of previous support at least.

THE SHORT SQUEEZE as STARTED PEAK ON JAN 112024The chart posted is my top view I am posting the weekly and daily of the value line For a reason it should NOT break the low of oct 27th 2023 If it is valid I have a major spiral from sept 21 2001 it is due NOW 11/10-13th the march 13th low was from june low 1949 . We will see rather soon which cycles are in force . and based on MY VIEW OF TLT 5 waves down ended

The TOP wave count THE SHORT SQUEEZE HAS STARTEDThe chart posted is MY top wave count This is a major WARNING to being short is a highest risk in a few years . The spiral turn due is from sept 21 2001 Low The market rallied over 24 % gain in less that 62 days That last low was in a word Perfect in its relationships within the fib . I have moved to an aggressive long calls position and The tlt has a classic end to the 5 waves down . This alone gives reason NOT to be short at THIS MOMENT in TIME

Value line geometric updated with multitimeframe sector analysisTo follow up on the previous post, added a snapshot of multi-timeframe US sector analysis
NYSE:VALUG AMEX:IWM AMEX:SPY NASDAQ:QQQ AMEX:DIA
Data as of September 22, 2023

My approach. Market Weather - Sept 22, 2023Many studies show that passive is superior to the active investment approach, and I agree that most money should be managed passively, using low cost broadly diversified index funds. Markets are mostly efficient in pricing securities, meaning there are not many proverbial 20-dollar bills you can find on sidewalks. However, some anomalies have also been well-documented, and one of them is momentum or trend-following. I am a value-conscious trend-follower. As a long-term investor, I believe valuations are key to portfolio returns, however, markets can and often trend far above valuations that offer acceptable risk-adjusted returns. This is where the study of price and trend-following come in. In my process, I ignore pundits, financial media — these are noise. I certainly don’t predict, instead listen to what’s going on with the price that reflects supply and demand. Price action to me is the best indicator (PhD, if you will) helping to manage risk and stay on the right side of the market. I believe, everyone could improve risk-adjusted portfolio returns, for at least part of their portfolio, and if you want to put in some time and effort, I am here to help you learn some ways to improve your process.
Last week's takeaways.
Of all the broad ETFs representing major asset classes, US dollar, commodity futures and short-term US treasuries appear the strongest. US stocks, except for the energy sector, are flashing ‘caution’ and all other asset classes — ‘danger’.
US large-cap ETFs, heavy on technology, consumer discretionary, have not broken the longer-term uptrends, but most stocks look ugly (as seen on NYSE:VALUG , AMEX:IWM charts). The question is, will the “generals” (like NASDAQ:AAPL , $Google) join the “soldiers” in retreat or lead them higher. The good news, stocks tend to get stronger after September.

Broadening Top for U.S. Stocks (VALUG)One valuable yet overlooked, a tool for gaining insight into the market is the Value Line Geometric Index (VALUG).
VALUG index contains a mix of roughly 1,700 stocks from the major North American market indexes.
It is equal-weighted, uses a geometric average, and has a daily change closest to the median stock price change.
VALUG uses an arithmetic mean, with the daily change in the index reflecting a portfolio consisting of stocks in equal amounts.
VALUG has a broadening top formation.

VALUELINE THE REAL CRASH IS MONTHS AWAY The chart posted is a great one so as to understand what still lies ahead WE ARE NOW CLOSE TO WHAT THE DEC FORECAST called for after a 13 yr Fake { FED Balance sheet} Bull market in assets . The avg decline over the last 120 years is 35 % peak to low .I said avg this one will look more like the 1973 to 1974 decline close to 50 % to 60 % when is all said and done . Over the last 13 years we had QE something that only made the top 1 % become the top .05% . I have pointed this out for the last 20 plus years and have become very well off And made a simple life way to many of you want to be Rich and not understand wealth is also time to have a simple life . money as well know it is called dollars to which it has been debased it buying power since dec 1971 . from 1.00 to now worth .027% to .045 cents sp has gone from 62 to 4818 and in constant dollars adjusted in 1971 dollars is about less than 5% gain the PONZI ended once again in nov 2021 .

WXY: double zigzagAt first, this looks like an expanding diagonal, which it is. But the internals are that of double zigzag.

Value Line Geometric Index / Balanced WeightingWell, that took a decisive turn for the worst in a short period of time.
In Indicating the VLGI would lead the ES... it dragged the ES by its nose
to new lows for the move quickly.
A song of broad weakness within the Complex.
_______________________________________________________________
Nothing encouraging here, merely more of the same.
Weekly and Monthly have turned to far less Positive Structures very quickly.
A series of Momentum bails that have not ceased.
Keep an eye on this Index, it doe a near-perfect job of providing ES directions.
Value Line Geometric Index / Balanced WeightingThe Value Line Composite Index is an Equity Index comprising 1,700 companies
from the NYSE, ASE, Nasdaq, Toronto Exchange, and OTC markets.
It is a Geometric Composite Index that is equal-weighted, uses a geometric average,
and has a daily change closest to the median stock price change. It is preferable to
the Value Line Arithmetic Index as it does not rebalance the end of every Trading
Session.
Similar to the NYSE Comp, but more highly correlated to the S&P500 with a better
balance and equal weighting.
It has provided an excellent signal as to when the S&P500 is about to correct.
________________________________________________________________________
I have been watching the Divergences build on the Weekly and Dialy timeframe, they
are approaching the tipping point whereby we will see the ES sustain an outsized corrective
move as soon a 1B Completes.

Valueline / SPX RatioWeightings are relevant.
The Valueline continues to form a nasty divergence with the S&P.
Equally weighted for Breadth Indications, which provide an early warning
Indication.
TSLA - a prime example of ES/SPX/SPY prop by unbalanced Heft, tipping the
scales - with the hidden hand in the shadows of the Scale.
The Symmetry shows a Date of November 18th for resolution, we shall see
as it appears holding this propped up Equity Complex into Black Friday &
Cyber Monday is going to be challenging.
ALL Signals are "Bullish" now. they have turned this mess and we're off to
5000 S&P / 18000 NASDAQ / 40000 DOW.
ATHs made in 2x and 3x Divergences?
Hmm... seems to be where were last time the Equity Complex took the NIKE
whoosh lower.
YOLO Traders are all in.
Apple and Amazon - "The ECONOMY is SLOWING"
The balance of the Globe - "Our ECONOMIES are SLOWING"

Expanding Ending DiagonalThis is a very rare pattern. We will be close to finish a 5 wave sequence since 1970s lows. We still need to finish the C wave of correction that started last year. Then we will have one of the biggest rallies in history before crashing imo.
Note: It is possible I got the first set of waves off the 09 low wrong and we have already completed the abc correction. In that case we are already in the midst of the biggest rally in history. The only way to tell for sure is to see how deep the next correction will be.

Leading indicators indicate Risk ON, but...My personal list of forward indicators on the weekly charts show that there has been a breakout on ALL four, namely JNK, IWM, DJT and VALUG.
The high yield bonds, small and mid caps, DJ Transport and Value Line all had a breakout this last week, suggesting a bullish breakout scenario.
However, the breakouts appear a little odd to me as candlestick patterns on two of the four are not particularly bullish. And one of the remaining (DJT) appears hesitant.
I would be wary of such a breakout really, but that is just me...

EW count on VALUGI like this count, it is a classic EW theory count. Really straightforward. THe waves are clearly depicted almost anyone can label them like I did. This is much harder to see in the other indices like SPX and Nasdaq.

Nas100My thoughts on the nasdaq ~ weve lined up perfect wit the common retace .... what do you think ?

using government debt as market entry pointsOften when money printing is halted (increasing debt is not taken on), markets experience turbulence, side ways action, increased volatility and even recession. So as long as increased money printing is happening we can be more confident of market liquidity and performance.

Equally Weighted Index Suggests SPX Could Go Near its 2016 Lows This is simply (forget all the FED stimulus holding these markets up) a case of market-cap weighted exaggeration vs an equally-weighted reality:
While the S&P500 Index (market-cap weighted) is bear rallying higher since its March 2020 lows, the Value Line Geometric Composite Index (equally weighted) is NOT confirming this move at all.
The SPX has made it back near its 2019 lows and 2018 highs while the Geometric Composite Index is currently only back up to near its 2016 market levels. This illustrates to me that the SPX is being pulled higher by the massive market cap of the big 5 technology stocks of the SPX - remove those names or equally weigh them in the index and we should be much lower, at least near the 2000 level on the SPX.

VALUG pullbacks are just indicative of general market pullbacks.I seen on a financial channel that there was a divergence between VALUG and the market, and that is the case on every pullback, VALUG gets hit harder is all, we were still seeing the affects of the 2019 pullback.


Value line not matching up with total market fundsTrading view does not have wilshire 5000 but it has a wilshire 4500 which is comparable, and it does not have vanguard total market fund VTSMX but it has a comparable fund called VTI which I hope is similar, but in this chart you see how each index's high technology allocations propped up their 2019 gains, where the whole stock market is not doing as well according to the value line index.


