VZ trade ideas
SLIGHT MOVE UP, BEFORE NEXT DROPHistorically when the TSI reaches this level, VZ rises at least 1.08% and moves an average of 3.10%. Most movement is between 2-3%. My conservative play is a movement to at least 55.75 over the next few weeks.
The previous movement from bottom to top in this trend channel took 52 trading days and the total move was 24.43%. I have laid out where those levels would be in this instance. the 52nd trading day is outside of my time period that I monitor but movement could still reach that level which is around 57.30. So far we are 35 trading days since the bottom was last attained.
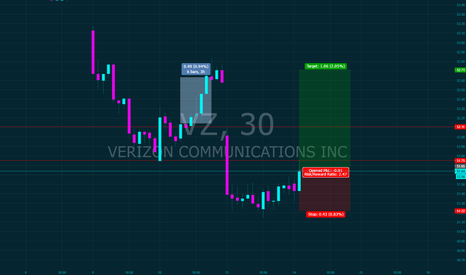
VZ SHORTHey there!
Generally speaking, I'm testing my new trading system.
IMHO, it is a great experience to write down all your trades, as it is much easier to analyze them later.
Thus, I'm publishing my ideas here. It will be also great if some of my trades will help all of us to get some profits)
I'm also attaching my risk calculations.
Normally, my risk per trade is 3.5% per trade.
It is much easier for me to trade when I understand what is my risk per position.
P.S. Target area is changing depending on entries (as you could notice I use multiple entries). I'm going to update all the data inculding targets as long as the trade remains opened.
Cheerz!
It's over for VerizonAt least for a while. Probably a long while. It appears that last July Verizon just completed a nice impulse wave from its 2008 low. Recent decline would be the beginning of a counter trend downward move that will bring prices down to 44 at minimum if not lower. I can even be more bearish if you want to but let's take it once step at the time. After all we have plenty of time, that impulse lasted nearly 8 years. This unfolding decline should last at least a couple of years.
VZ Long on long term technicals Long VZ on two major technical support indications at ~52-52.50. On the daily chart dating back to mid 2013 the ~51.50 region acted as strong resistance. We now look to this region as possible support. This also coincides with an upward trending channel which has formed over the last year. Currently, VZ sits at the bottom of this channel at support in the ~52-52.50 range. I look for an entry here at 52.25 with a price target of 56.00 and a stop of 51.25. RR of 100/375. If you follow my 10000 USD base account recommendations I advise a 100 share long position.
Good place to long$VZ stock has declined a bit from its July high but the techinals are suggesting a turn around. Stock RSI is oversold and RSI is approaching the bottom range. A tight stop at previous support turned resistance (51.60) insures not much will be lost if this does not pan out. Add on to this $VZ provides a nice dividend(4.3%) and it could be worth holding if there is further consolidation before upswing.


