Ascending order candle in wiproFinally wipro broke weekly support
And now trying to get new levels and swing
WIT trade ideas

WIPRO Make falling wedge chart pattern in 4 hour time fram , 50 EMA cross 100 EMA from below , MACD and histogram saw fair value,
Take break out with High volume and make retest at resistance level so first Target will be 435.90 and Stop loss will be 384.95
This is for educational purpose not a trading advice so that's my view comment down your view 🤗

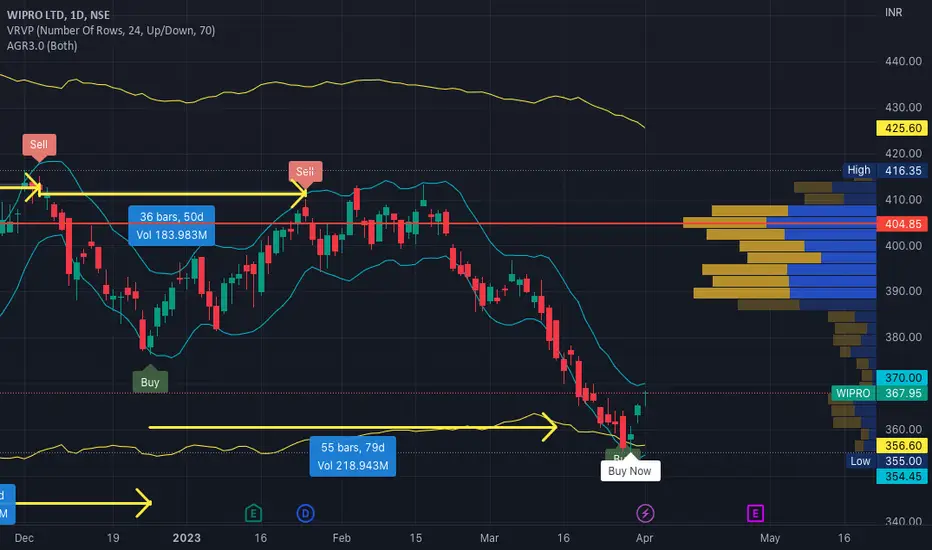
ready to go up. 200 MA cross over + Breakout with good volumeBuy wipro. Solid breakout and 200 SMA crossover. Good volume

Wipro go LongIn wipro daily time frame a perfect cup and handle pattern is formed with strong bullish candle break resistance with volume and retest is also done now it is acting as support. Go long on wipro for positional trade. target is next resistance. If you like this idea please give it a boost Good luck to you all.

Wipro Moving in a broadening Triangle.Wipro Moving in a broadening Triangle, waiting for breakout or resistance.

Investment Pick!Wipro was trading in a downward channel and it has given breakout this week. Now we can assume the up move in the stock. Wipro is IT gaint and overall IT sector is looking good after Nasdaq has given a double bottom breakout few weeks earlier. Hence I am really optimistic about whole IT sector. All the IT stocks have taken very good beating and a good amount of correction is visible in all the IT stocks in spite of good results.
CMP - 401 (26/5/23)
T - 450, 480 W
SL - 370 W

Wipro @ Supply Zone + ResistanceObservations::
----->> It is near its resistance.
previously a strong fall is observed here, a strong fall happens before day,
but price is again showing bullish pressure, price may reach again 408, 413 zone,
keep track this for continue or reversal.
Keep on buyside for the target of 402,405.

WIPRO - Weekly AnalysisIn the Weekly Chart of WIPRO ,
we can see that, after a huge correction, recovery is done in W Pattern.
Also it is retested.
Enter with SL and go long for a year for goof % of returns.


WIPROHello & welcome to this analysis
WIPRO in the weekly time frame has activated a Bullish Harmonic Alt Bat.
It could be accumulated between 360-415 for upside targets of 525-600.
View goes wrong below 325

WIPRO INTRADAY IDEA ON 28-04-2023in WIPRO we will take a long trade,this content is made for learning and educational purposes only. we are not responsible for any losses or profits.

W pattern in wipro (very bullish)Wipro made w pattern at the bottom of the chart which made it very bullish for future.
Buy it at above 380 (candle close above third level)
Target 386.95 394.50 400 408.20
Sl 367

short350 target in few days as showing weak in chart ................................................................................................................................................................................................................


Wipro: Time for reversal?I see two scenarios for the reversal tred for Wipro. Most likely it will follow the first support. Incase does not respect it I will wait till the second scenario. Below that I dont see positive for this share.

WIPRO SHORT,WEAK IN OPTION CHAINWIPRO at support and that is weak so break as per option chain data
ENTRY- CMP
TARGET 360.35
SL 371.92

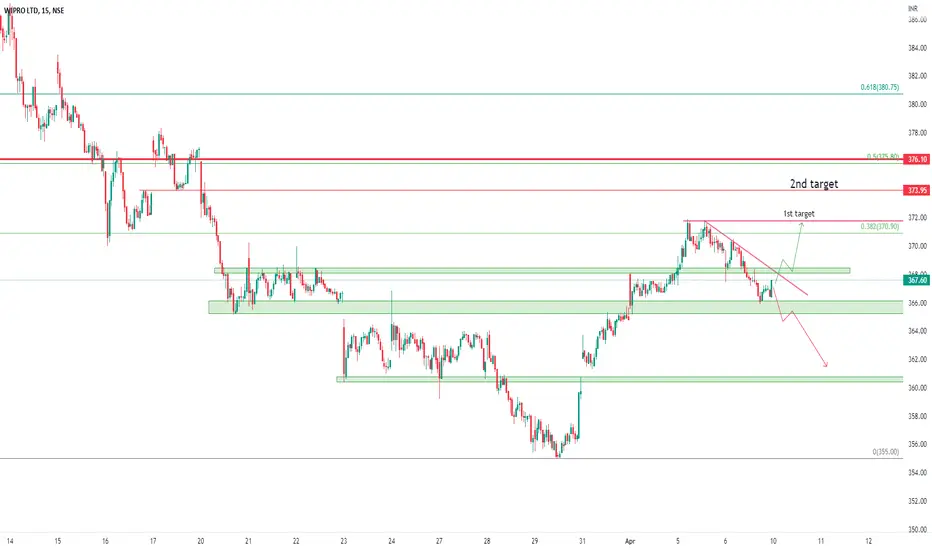
INTRADAY IDEA ON 12-04-2023short trade after retest of breakdown, this content is for educational and learning purposes only.

WIPROhere are the levels for Wipro to trade for tomorrow intraday. can take both the trades if the price price breaks the trendline and closes above the resistance then we can take the long side entry and if the price breaks the support and on the retest we can take the short side trade.
DISCLAIMER: This is my own analysis and you do your own analysis before you take any trade and I am not SEBI registered and contact your financial adviser before taking any trades .I am not responsible for your profit or loss. This is only for educational purpose and learning.
comment below if you have any doubts.
Wipro can be a good buy at this level
Wipro can be a good buy at this level for upside of around 5% in very short term.
WIpro and the power of fibonacci levelsthese levels are given for near future price of Wipro
Wipro will follow the predicted path if it fails the neckline retest....
this analysis is purely based on Fibonacci levels only

Wipro Break Very Importent Level wipro break importent level with 200W Moving Average. In upcoming weeks we will see a fall In wipro stocks
(Always Do your own analysis)

Wipro LongComplex correction in wipro is almost complete now.Can think of going long on this counter now.

WIPRO - Weekly AnalysisIn the Weekly Chart of WIPRO ,
we can see that, it is at make or break level.
375-380 support has been tested multiple times....support has now become weak.
we might see 350 levels if it break down.
