WMT Current WaveRemeber in Elliot wave, it's all about waves made out of waves. Watch for these levels!
WMT trade ideas

WMT Trading Activity Follow to see my WMT option trading activity. I will post a new chart with every trade. I will be exclusively swing trading WMT.
Chart is provided, feel free to ask questions about the indicators if you are unsure.

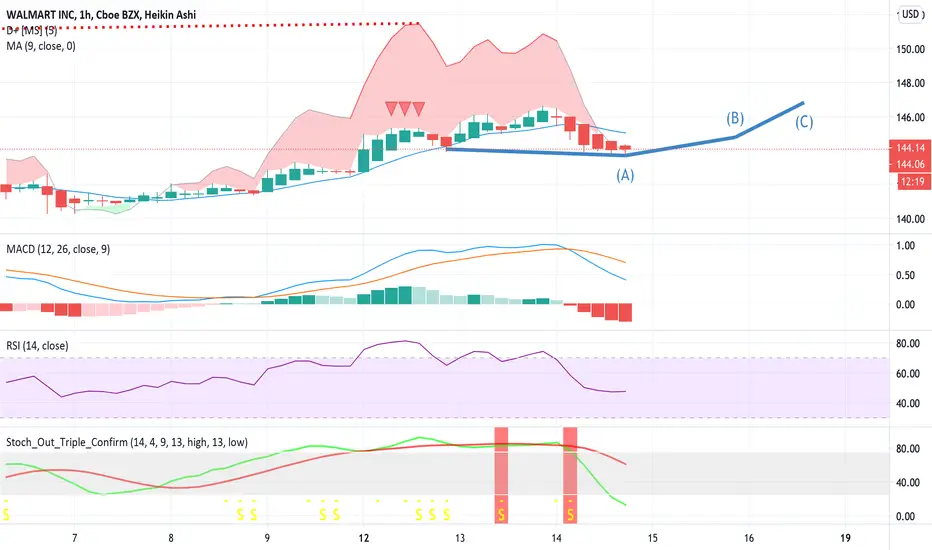
Walmart by the Hour With the small candle at point A we can see that the bearish selling has been getting weaker. The MACD shows strong bear strength but could quickly weaken. As they are loosing buying strength. How do I know they are loosing strength? Take a look at the RSI. WMT returned to its normal range of 48 for its RSI and does not historically stay that low very long. Follow to see how my trend line turns out, give a like if you are a Walmart Bull, and finally comment your thoughts if you agree or disagree. Would love to hear your thoughts. Thank you!
10/12 WMT Ascending TriangleAscending bullish triangle on a 4 hour chart.
I believe a closing candle above $143-$143.50 and we can fly to $150 by the end of the week.

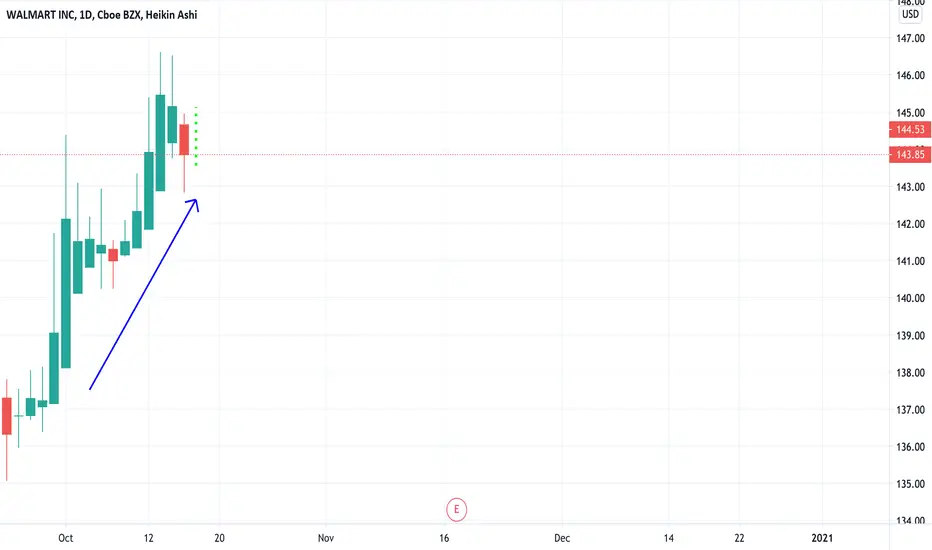
WMT Daily Candlestick Prediction Here is my daily candlestick prediction for WMT. So far I am 1 for 2 in my predictions ( linked below )

Walmart 1 month Analysis Looking at the one month chart ( 30 min candles ) we can see that Walmart has hit its highest low putting it in place to reach its highest high. With growing bullish divergence and a low RSI we can expect Walmart to make a swift comeback.

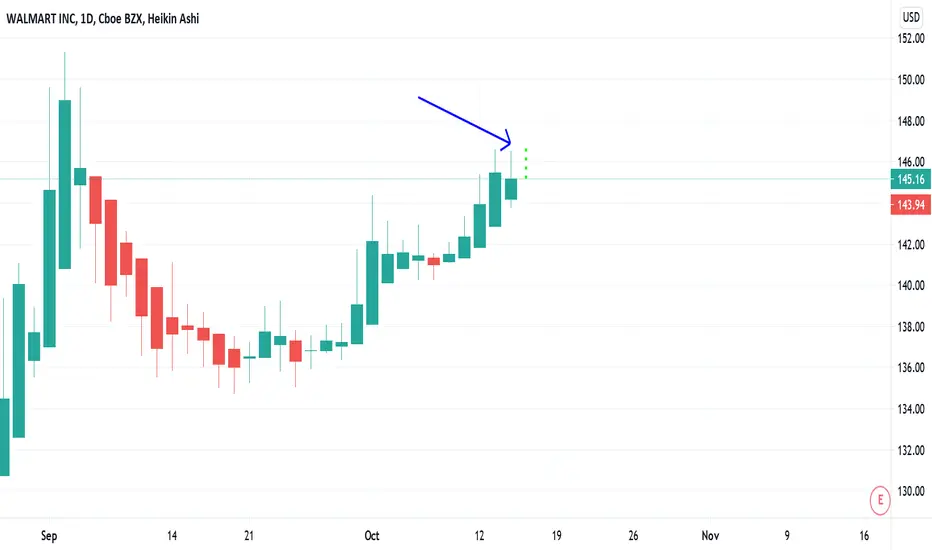
Daily Candlestick Prediction For WMTI love candles and based off my analysis this is where I see tomorrows candle for Walmart. I am 1 for 1 in my WMT candlestick analysis. Check out my previous prediction linked below and follow for daily updates!
WMT Long Term cycleIn the middle of a long term wave 3 for WMT, went in shares on September dip, will trim positions as we approach 1.618 level, will buy 4 wave dip as close to the bottom as possible

Daily Candle Stick Prediction for WalmartBased on pure candle stick analysis I have made my prediction for the 10.13.2020 candle. Stay tuned to see how accurate or inaccurate I am. This is a segment that goes alone with my main Walmart thesis ( linked below ) check it out to see my thoughts on WMT.

150 calls for next week?seems like a clear breakout/uptrend. we may add some calls by friday! after we sell baba for 200% ;) gl

wmt channeldrew this in the morning and watched it trend within the lines all day so I thought id share here. had a note for target of between 146.62 (full break out) and 146.58, i kinda shocked myself how accurate these were. please help me grow by giving a comment, like and of course a sub!

Walmart Flying HighLooks like Walmart is just in a euphoric state, keeps rising. Looking at the 1 day chart to determine when stock will drop. It may continue its steady up trend until earnings. With a high RSI and the candles moving further and further away from the moving average you think to scream sell. However, if you look at the most current candle stick ( Tuesday October 13th ) you can see it has a huge bull wick. The bullinger bands have not crossed yet, the RSI seems to max out at 75 for Walmart ( currently 70 ) and the MACD shows growing bull strength. This will be a fun one to trade. Will be watching for the sell signal. I will post when a daily sell signal arises.
Like if you are a Walmart Bull and think it will continue rising high into earnings, and comment any thoughts/opinions. Would love to hear your take on it.
Current Position: 2 Calls @ 4.55 a contract Expires 12/18
Put myself in a strong position to average down if needed.

Walmart about to reach a higher low Walmart is cruising into earnings, however we are on our way to hit a higher low. I believe some point this week WMT will hit $143 a share. Here's the technical analysis that explains why.
RSI: Relative Strength index is at 60 and an average for Walmart is close to 55. With the high RSI we can see price decrease as investors are seeing Walmart being overbought.
MACD: Shows that there is growing bearish divergence, bears are getting stronger meaning they might take more control of the stock price.
My plan?
My plan is to buy Calls on the dip. I am going to purchase 12/18 Call for WMT to be $150 a share.
Follow to see my trades, and give a like if you see Walmart growing, and part of growing means hitting higher lows.
Comment your thoughts on my analysis, I would love to be critiqued.

Breaking Through Previous SupportMulti-time frame analysis shows this to be a snap back into greater trend


Opportunity to buy into WMTThis is a personal publication that I am posting public for those who are following me and watching my account grow.
There are a lot of indicators that are showing a near term drop for Walmart, this would create a good buy in point.
Since we are in a bull market, we should expect Walmart to rise the remainder of the year.
Why do I think there will be a small drop in the short term?
High RSI: 65
Bollinger bands about to cross at a high point indicating a sell signal.
Growing bearish strength on the divergence indicator.
MACD: Showing weakening bullish divergence
Candles are also moving down closer to the Moving Average
As an options trader a small dip could lower options cost for an opportunity to buy more contracts and make more money.
Stay Tuned for updates!


Headed up to finish wave 5?### Beginner Chart ### This is not financial advice.
If the count is right then we'll see 155 hopefully by earnings


WMTTrading nicely with in the channel since April 29th small gap down. With up coming earnings season, expecting for a continued upward movement with in the channel. 140-135 range should act as good support

