WMT trade ideas

Walmart in a bullish channel.Walmart - 30d expiry - We look to Buy at 154.33 (stop at 150.33)
Price action continues to trade around the all-time highs.
Trading within a Bullish Channel formation.
We look to buy dips.
The primary trend remains bullish.
Trend line support is located at 154.
This stock has seen good sales growth.
Our profit targets will be 164.33 and 166.33
Resistance: 159.50 / 161.00 / 163.00
Support: 157.50 / 155.00 / 154.00
Please be advised that the information presented on TradingView is provided to Vantage (‘Vantage Global Limited’, ‘we’) by a third-party provider (‘Everest Fortune Group’). Please be reminded that you are solely responsible for the trading decisions on your account. There is a very high degree of risk involved in trading. Any information and/or content is intended entirely for research, educational and informational purposes only and does not constitute investment or consultation advice or investment strategy. The information is not tailored to the investment needs of any specific person and therefore does not involve a consideration of any of the investment objectives, financial situation or needs of any viewer that may receive it. Kindly also note that past performance is not a reliable indicator of future results. Actual results may differ materially from those anticipated in forward-looking or past performance statements. We assume no liability as to the accuracy or completeness of any of the information and/or content provided herein and the Company cannot be held responsible for any omission, mistake nor for any loss or damage including without limitation to any loss of profit which may arise from reliance on any information supplied by Everest Fortune Group.

WMT - Long term wave countIn the weekly chart, I see the long uptrend run in its final stages.
My final target is the 163.27 to 174.55 range, corresponding to the 100% to 161.8% ABC extension.

Digital and technical analysisWe see that there is an increase in the buying momentum and we are in a correction
Digital and technical analysisWe see that there is an increase in the buying momentum and we are in a correction

WMT benefits from consumer confidence LONGWMT may be benefiting from the potential suspension of federal rate hikes potentially
giving consumers more buying confidence and maybe a stabilization of credit card rates
as another form of relief. On the 4H chart, WMT is showed with a pair of anchored VWAP
bands set at the beginning of a prior breakout on June 30th and the pivot high on July 5th.
Price had descended to the third deviation green lines below the mean VWAPs zone ( black
lines) but has now ascended to the first deviation blue lines below the mean VWAPs.
WMT is in an early VWAP breakout at this point as price approaches the mean VWAP.
The MFT RSI indicator of Chris Moody shows both low and high TF RSIs now above the 50 level
and the low higher than the high demonstrating bullish momentum. The zero-lag MACD
is also confirmatory showing a line cross under the histogram on July 11th.
I find WMT suitably set up for a swing long trade. I will seek out the best entry on the
15-30 minute time frame by identifying a privot low from which to enter. The target
is the red second deviation lines above the mean VWAP zone at $158.25. A call options
trade would be for $157.00 with a 9-10 DTE.

WMT Entry, Volume, Target, Stop, ResistanceWhen price clears: 154.64
With daily volume greater than: 5.89M
Target: 163.75 area
Stop: Depending on your risk tolerance; 151.62 gets you 3/1 Risk/Reward.
Resistance: 160.77 area
This swing trade idea is not trade advice and is strictly based on my ideas and technical analysis. No due diligence or fundamental analysis was performed while evaluating this trade idea. Do not take this trade based on my idea, do not follow anyone blindly, do your own analysis and due diligence. I am not a professional trader.

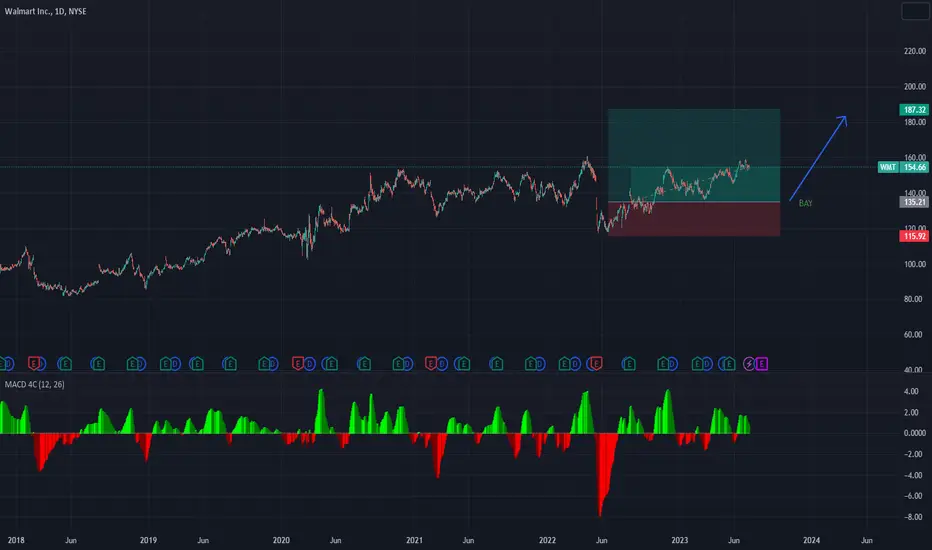
Walmart (WMT) | The Long-awaited Breakout!Hi,
Waited for the end of June and we got the highest monthly candle close in Walmart history!
The area between $150 to $154 has been like a nightmare for WMT. As you see in the image it has tried many many times to make a breakthrough. Finally, it happened, barely but still, the price of Walmart has got the confirmed move, at least I like to think like that.
Literally, investors are ready to pay higher prices for WMT stock, we got that "letter" from investors, we take it as a sign and we are ready to make a buy from the current prices to $145.
This idea shows also how important is technical analysis! No matter what the WMT stock does from now but if you invested before that breakout (after the price reached the first time $150), then your money has been stuck for half a year to two years (depending on when you discovered it) in this asset! In the meantime, you see that almost the entire market is rallying.
So, if you have such a strong area, as Walmart has there around $150, then it is always wise to wait for a little letter from investors that they are ready to pay the first time, atm within three years, the highest price than before!
As the JPMorgan survey says: more profitable is to buy when the market has made an all-time high than on any random day. Again, it will confirm that the timing/technical analysis plays a key role in investment decisions!
* Considering technical analysis then the optimal buying zone should stay from current prices to $145.
* First target is $180 and currently the major one should stay around $200
Good luck,
Vaido

WALMART in need of a short term technical correction.Walmart has been trading inside a Channel Up since March and just formed a Higher High Top, same as on May 10th.
The main Support is the MA100 (1d) and long term the MA200 which is holding since October 21st 2022.
Trading Plan:
1. Sell on the current market price.
2. Buy at 152.00 as long as the candle is closing over the MA100 (1d).
Targets:
1. 152.00 (bottom of the Channel Up and 0.5 Fibonacci level).
2. 164.00
Tips:
1. The RSI (1d) also formed a pattern that is consistent with market tops since 2022.
Please like, follow and comment!!

WalMart stock is accelerating!WalMart stock is accelerating!
This chart shows the weekly candle chart of Wal Mart stock since the end of 2019. The graph overlays the golden section above the 2020 low point. As shown in the figure, the low point of Wal Mart stock in May this year just stepped back to 1.382 in the golden section of the figure, and the low point of the past three weeks just stepped back to 1.618 in the golden section of the figure! This shows that Wal Mart shares are in the early stage of accelerated growth, and the rate will probably break through the previous high! The next strong pressure level is the 2.000 position in the golden section of the graph (around 164.7)!

$WMT with a bullish outlook following its earnings #StocksThe PEAD projected a bullish outlook for NYSE:WMT after a positive over reaction following its earnings release placing the stock in drift B with an expected accuracy of 100%.

WMT Walmart Options After The EarningsIf you haven`t bought WMT Walmart here:
Or sold it here:
Now Analyzing the options chain of WMT Walmart prior to the earnings report this week,
I would consider purchasing the $155usd strike price Calls with
an expiration date of 2023-7-21,
for a premium of approximately $4.10
If these options prove to be profitable prior to the earnings release, I would sell at least half of them.
Looking forward to read your opinion about it.

WMT Earnings tomorrow morningWMT basically triple topped with accumulation significantly lower than 2021 (not shown because I don't want to change my template, lol)
I don't think earnings will be good enough to justify this recent runup the past couple of months, bought some puts.
Remember, earnings is a complete crap shoot, the market pumped TGT on poor guidance today, lol.

Walmart’s controversial financial image
Shares in Walmart, Inc. (symbol ‘WMT’) managed to recover from the losses incurred in the first quarter of the year and is currently in profit area testing the latest high of November 2022. The company is expected to report its earnings for the fiscal quarter ending April 2023 on Thursday 18th of May, before market open. The consensus EPS is $1,30 compared to the result for the same quarter last year of $1,30.
‘ The financials of the company are flashing “caution” signals all over the place. The net profit of the world’s largest retailer dropped by 15% year over year as of 31/01/2023 while the assets to liabilities ratio dropped also from 1.51 to 1.46 indicating the liabilities are growing while assets are declining in value on the financial statements. Dividend yield is at the low area of 1.49% while the payout ratio is at 53% which is not bad nor good news for investors. ’ said Antreas Themistokleous, an analyst at Exness.
On the technical side the price is trading in an aggressive bullish momentum after the first quarter and is currently testing the upper band of the Bollinger bands which is acting as a resistance on the price at the time of this report.
While the 50 day moving average is still above the 100 day moving average and therefore validating the bullish trend the $150 area is a strong technical support level since it consists of the psychological support of the round number, the 20 day moving average and is also just below the 78.6% of the monthly Fibonacci retracement level.
The Stochastic oscillator is in the extreme overbought area possibly indicating that a minor correction might happen before we see a continuation of the upward moving trend.

WMT Rising wedge On the chart we can see a rising wedge.
The price broke down of the pattern.
We are expecting the price retest previous support and confirm it as a resistance, which would be our entry for the short position.
Stop loss: 155.14
Target: 138.44

walmart forecast future abc patternim forecasting a sell off from B leg of the ABC pattern after the 5th Elliot wave is completed. There will be a bullish abcd pattern set up w/ a D leg sell off from the retest of the highs

Walmart short on 45 minWe are expecting the stock to hit the strong resistance and the rejection of the price.
Enter when the the price hit the resistance at 154.48.
Stop loss at 154.83
Taking profit at 149.94


WMT symmetrical triangleWhat we can see on the chart is the symmetrical triangle which is neutral formation therefore we should wait with taking position as it may breakout to the upside or to the downside.
How to trade:
Enter long or short position once the price breakout of the triangle.
Targets for longs and shorts are shown on the chart.
In order to avoid trading the fake breakout, look for a volume surge.
Good luck

Walmart vs eurodollarNow, if the fed pivots may 2nd.. i'd expect walmart to fly sky high to new highs.. but theres a recession coming. Aint nobody going to buy walmart into new highs in the face of a recession. me thinks ****s about to hit the fan.

Walmart primary trend remains bullish.Walmart - 24h expiry - We look to Buy at 139.11 (stop at 134.61)
Levels below 140 continue to attract buyers.
The primary trend remains bullish.
This stock has seen good sales growth.
Preferred trade is to buy on dips.
A higher correction is expected.
Our profit targets will be 150.11 and 152.11
Resistance: 150.00 / 151.12 / 153.00
Support: 148.15 / 147.00 / 145.00
Please be advised that the information presented on TradingView is provided to Vantage (‘Vantage Global Limited’, ‘we’) by a third-party provider (‘Signal Centre’). Please be reminded that you are solely responsible for the trading decisions on your account. There is a very high degree of risk involved in trading. Any information and/or content is intended entirely for research, educational and informational purposes only and does not constitute investment or consultation advice or investment strategy. The information is not tailored to the investment needs of any specific person and therefore does not involve a consideration of any of the investment objectives, financial situation or needs of any viewer that may receive it. Kindly also note that past performance is not a reliable indicator of future results. Actual results may differ materially from those anticipated in forward-looking or past performance statements. We assume no liability as to the accuracy or completeness of any of the information and/or content provided herein and the Company cannot be held responsible for any omission, mistake nor for any loss or damage including without limitation to any loss of profit which may arise from reliance on any information supplied by Signal Centre.

Short Walmart to 142.50Entry: 150.75
Stop: 151.15
PT: 142.50 (gap fill)
Risk to Reward (R/R): 20.62
Walmart looks overextended and has rejected 151 3 times including today. Stop is placed at 151.15, a few cents above the recent high of 151.12.
Low risk / high reward!

Walmart: Within Reach 🙌Ever been to the supermarket and couldn’t reach the topmost rack? Walmart seems to have a similar problem, struggling to let go of the mark at $150.12 to hit the turquoise zone between $152.54 and $161.76. However, we expect the share to touch at this area soon to finish wave B in turquoise. This done, it should turn downwards, returning below $150.12 and slipping further below the support at $136.09 to complete wave (A) in magenta. After a short counter movement back above $136.09, the share should drop below the support at $117.27 and into the gray zone between $116.49 and $105.01 to place the final low of wave IV in gray, which should then initiate a new upwards trend. There is a 37% chance, though, that Walmart could shoot through the turquoise zone and conquer the resistance at $161-76 directly.
