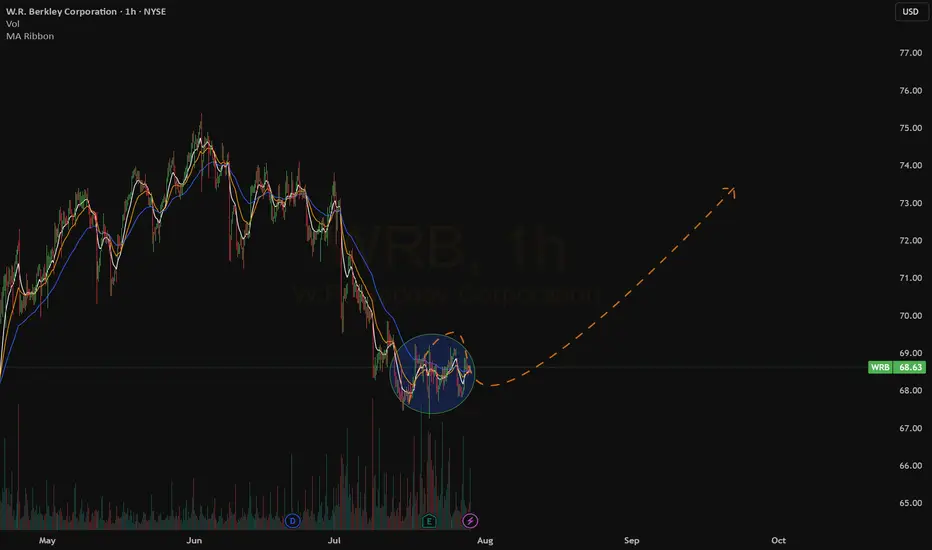
New Setup : WRBConslidation area at $68-$69 with emas that are now flat.
The hourly chart looks good to me without earnings right now.
An action higher will create a enw ATR Alert as well
Ready To catch it !
WRB trade ideas
moving down to supportA small move of 66 or less is incoming; expect a retrace. The swing could take a while, and there's no rush for stochastic to move significantly.

W.R. Berkley (WRB): Insurance Stock Eyes Next Bullish MoveW.R. Berkley Corporation (WRB) is a leader in the commercial property and casualty insurance space, offering specialty coverage through a wide network of independently operating businesses. With a strong focus on underwriting discipline and long-term risk management, the company continues to expand strategically while maintaining financial strength. As businesses increasingly seek tailored insurance solutions, WRB remains well-positioned for steady growth and resilience in shifting economic conditions.
On the technical side, WRB is showing bullish movement after bouncing off the 0.50 Fibonacci retracement level. The price has since moved through the 0.382 level and is now approaching the 0.236 line—the threshold that defines the momentum zone. While it hasn’t crossed into that zone just yet, this setup suggests strengthening price action. If the stock breaks above the 0.236 level with continued volume, it could mark the beginning of a stronger trend higher.

WRB RotationTesting a few technical indicators during a cyclical rotation here:
- Volume Profile
-- 50 day lookback "Quarterly PoC" | Price is at PoC
-- 100 day lookback "Power PoC" | Price is at PoC
-- PoC Price | Blue = Long
- 200 Day Moving Average
- provides baseline for Long/Short basis | Price > MA = Longs
- Volatility Radar
-- highlighted background indicates:
--- compressed volatility | Entry Allowed
--- trend intensity is showing a "weakening" bearish trend | Mixed on Direction
- 50 Day Moving Average
-- used as the ultimate exit after price goes above it
Good Luck!

Short, target 60.97Following weekly chart.
I got a short signal from my power indicator, now let's check where it should go.
Following fibonacci level and support levels, I see a big opportunity between 60.92-61.62
Also we have a gap in 60.92 which supports this idea.
There might be still an uptrend, my stop loss level is above 623.23 weekly close.
Any thoughts?

$WRB with a bullish outlook following its earnings #StocksThe PEAD projected a bullish outlook for NYSE:WRB after a negative under reaction following its earnings release placing the stock in drift D with an expected accuracy of 60%.

W.R. Berkley (WRB) Long PositionW.R. Berkley (WRB) is an undervalued stock in the insurance sector, with strong fundamentals and positive earnings outlook, making it a potential buy, especially after the recent dip in price. A long position with a price target of $61.24 looks attractive, but setting a tight stop-loss around $50 is cautious to manage downside risk if the broader market remains volatile.
Possible scenario is shown on the chart.
Good luck!

$WRBWRB is having formation of I&H continuation pattern , pattern would be valid 3% above the neckline

WRB daily bearish hammer at all time highWRB daily bearish hammer at all time high would expect at least ABC correction

WRB daily - possible bullish tradeWRB is a strong/bullish fundamental stock and therefore would be traded only in a long position.
WRB daily - is in a nice and big symmetrical triangle after leg up which is very bullish. Volume is lower which indicates there is no seller at the moment and the price consolidates at that level which is also bullish. Price is moving closer and closer to the end of the symmetrical triangle which will move stock very strongly.
RSI is neutral.
MACD histogram is ticking up, while the MACD line started to separate from the signal line which could indicate a strong bull move.
Overall: creating the symmetrical triangle after leg up is a bullish pattern especially if prices consolidate on smaller volumes like it is an example on this stock. Break above and daily close or strong move on high volume above blue upper dotted line would trigger a long position with stop loss below the green line or 20 days MA. WRB is a bullish fundamental stock therefore would be traded only on the long side. Break down below symmetrical triangle would NOT trigger short trade due to the fundament.

WRB daily - possible bullish tradeWRB daily - is in a nice and big symmetrical triangle after leg up which is very bullish. Volume is lower which indicates there is no seller at the moment and the price consolidates at that level which is also bullish.
RSI is neutral.
MACD histogram ticks start green while the MACD line is trying to move above the signal line which is bullish.
Overall: creating the symmetrical triangle after leg up is a bullish pattern especially if prices consolidate on smaller volume. Break above and daily close or strong move on high volume above blue upper dotted line would trigger a long position with stop loss below the green line or 20 days MA. WRB is a bullish fundamental stock therefore would be traded only on the long side. Break down below symmetrical triangle would NOT trigger short trade due to the fundament.

$WRB with a Bullish outlook following its earnings #Stocks The PEAD projected a Bullish outlook for $WRB after a Negative Under reaction following its earnings release placing the stock in drift D with an expected accuracy of 33.33%.

$WRB with a Bullish outlook following its earnings #Stocks The PEAD projected a Bullish outlook for $WRB after a Negative Under reaction following its earnings release placing the stock in drift D.

The deal closed WRB in US stock market with profitAlhamdulillah , The deal was closed on WRB in US stock market with a profit of 6.1 % in a 1 week . I wish good luck to everybody.

Buy WRB in US stock market 4/8/2022You can buy it Target 64.79 and 68.36 stop loss 59.8 money management is your responsibility I recommend entering a maximum of 10% of the portfolio. good luck

WRB 1D wolfe wave bearish 4/5A Wolfe Wave is a chart pattern composed of five wave patterns in price that imply an underlying equilibrium price. Investors who use this system time their trades based upon the resistance and support lines indicated by the pattern.

WRB 30m wolfe wave bearish 12/12A Wolfe Wave is a chart pattern composed of five wave patterns in price that imply an underlying equilibrium price. Investors who use this system time their trades based upon the resistance and support lines indicated by the pattern.

BERKLEY(W.R.) CORP Post DailyHello traders, BERKLEY(W.R.) CORP is in a fake bearish configuration with more buying volume for a while and sellers rejection. On the TIMEFRAME M1 we can observe a bounce under the VWAP of sellers with a high volume of sales. It is heading towards its next lower to make a reversal, strong likelihood of breaking the VWAP to go to the previous last higher. But not enough force to reach above and at the same time test the median. We are going to stay on the symbolic number 67.00.
Please LIKE & FOLLOW, thank you!


Buy Berkley #WRB weekly demand level around 57.75Buy Berkley #WRB weekly demand level around 57.75. Clear uptrend, waiting for a retracement to previous demand imbalance for long term investment
