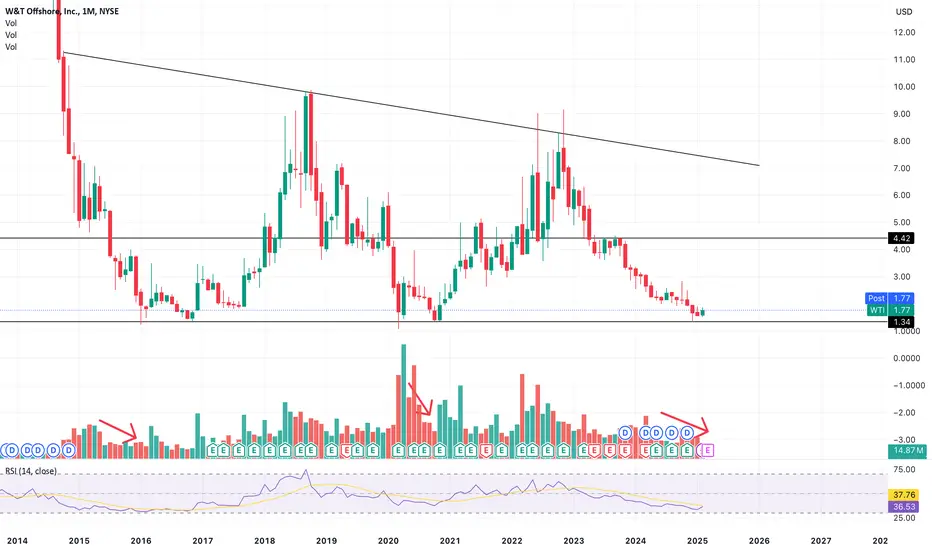
$WTI reversalI think we start to see a reversal now
Decreasing volume consolidation showing
RSI looks bottomed and primed for a bounce-back
Hit a really important level at $1.4 and bounced at multiple bottom
Long Term PT $7
Will take time, lets see what happens
Next report date
—
Report period
—
EPS estimate
—
Revenue estimate
—
−0.72 USD
−87.14 M USD
525.26 M USD
97.42 M
About W&T Offshore, Inc.
Sector
Industry
CEO
Tracy W. Krohn
Website
Headquarters
Houston
Founded
1983
FIGI
BBG000FFFQR6
Crude Oil is a naturally occurring liquid fossil fuel resulting from plants and animals buried underground and exposed to extreme heat and pressure. Crude oil is one of the most demanded commodities and prices have significantly increased in recent times. Two major benchmarks for pricing crude oil are the United States' WTI (West Texas Intermediate) and United Kingdom's Brent. The differences between WTI and Brent include not only price but oil type as well, with WTI producing crude oil with a different density and sulfur content. The demand for crude oil is dependent on global economic conditions as well as market speculation. Crude oil prices are commonly measured in USD. Although there have been discussions of replacing the USD with another trade currency for crude oil, no definitive actions have been taken.
Related stocks
WTI may go uphi traders
WTI looks good here.
We are getting a bullish englufing candle on the weekly degree. It may be a sign of a trend reversal.
Around 4,40 $ we should see a strong resistance.
Looking for a pullback to enter long.
Entry, target and stop loss are shown on the chart

Crude Oil At Pivotal Resistance: Target $10Based on the current chart, it appears that BLACKBULL:WTI crude oil is approaching an inverse resistance level—a threshold it has decisively surpassed only twice before. The first instance occurred in 2015, a period influenced by OPEC's late 2014 decision to maintain production levels instead of c


WTI headed under $4 again!Most time frames are oversold atm and shows price severely dropping as low as 3-4$ NFA but do set alerts and read the market again.

W&T Offshore: Holding Above Supply Line and SupportRight now WTI is breaking above the Supply Line of what looks to be some kind of Bump and Run Reversal Bottom at an Ice Line while forming somewhat of an Inverted Head and Shoulders Pattern. If this level holds we could see it go for the next major level of support/resistance all the way up at $44.5

OIL Moving up? WTI double bottomI got into this yesterday at $4.40 speculatively but we are holding and moving up so I thought I would share this trade. It looks like a good oversold condition on many time frames, sitting at support as well. Macd curling up potentially! I'd like to target that 200ma personally, then let some ride.

Sell to Open WTI Nov 18 2022 5 Put Limit at $0.05 (Day)Sell to Open WTI Nov 18 2022 5 Put Limit at $0.05 (Day)
End of the correction

$WTI - Power Earnings Gap Watch EntryWatching $WTI as a PEG Strategy. The latest drop in price appears to be headed to AVWAP from day of gap up. Watching for support.

WTI bounce areaWe are bouncing off a demand zone and fib retracement line.
Green zones are supply zones pulled from various time frames (daily, H8, H4, H1) ($5.5, $6.8, $7.4 are supply zone areas)
We could have a nice run into earning as USOIL futures corrected quite a bit and looks to be bouncing now.

See all ideas
Summarizing what the indicators are suggesting.
Neutral
SellBuy
Strong sellStrong buy
Strong sellSellNeutralBuyStrong buy
Neutral
SellBuy
Strong sellStrong buy
Strong sellSellNeutralBuyStrong buy
Neutral
SellBuy
Strong sellStrong buy
Strong sellSellNeutralBuyStrong buy
An aggregate view of professional's ratings.
Neutral
SellBuy
Strong sellStrong buy
Strong sellSellNeutralBuyStrong buy
Neutral
SellBuy
Strong sellStrong buy
Strong sellSellNeutralBuyStrong buy
Neutral
SellBuy
Strong sellStrong buy
Strong sellSellNeutralBuyStrong buy
Displays a symbol's price movements over previous years to identify recurring trends.
Frequently Asked Questions
The current price of WTI is 1.70 USD — it has decreased by −3.95% in the past 24 hours. Watch W&T Offshore, Inc. stock price performance more closely on the chart.
Depending on the exchange, the stock ticker may vary. For instance, on NYSE exchange W&T Offshore, Inc. stocks are traded under the ticker WTI.
WTI stock has fallen by −2.86% compared to the previous week, the month change is a −0.58% fall, over the last year W&T Offshore, Inc. has showed a −30.04% decrease.
We've gathered analysts' opinions on W&T Offshore, Inc. future price: according to them, WTI price has a max estimate of 10.00 USD and a min estimate of 2.25 USD. Watch WTI chart and read a more detailed W&T Offshore, Inc. stock forecast: see what analysts think of W&T Offshore, Inc. and suggest that you do with its stocks.
WTI stock is 4.73% volatile and has beta coefficient of 1.06. Track W&T Offshore, Inc. stock price on the chart and check out the list of the most volatile stocks — is W&T Offshore, Inc. there?
Today W&T Offshore, Inc. has the market capitalization of 251.01 M, it has decreased by −5.62% over the last week.
Yes, you can track W&T Offshore, Inc. financials in yearly and quarterly reports right on TradingView.
W&T Offshore, Inc. is going to release the next earnings report on Aug 4, 2025. Keep track of upcoming events with our Earnings Calendar.
WTI earnings for the last quarter are −0.13 USD per share, whereas the estimation was −0.15 USD resulting in a 13.33% surprise. The estimated earnings for the next quarter are −0.17 USD per share. See more details about W&T Offshore, Inc. earnings.
W&T Offshore, Inc. revenue for the last quarter amounts to 129.87 M USD, despite the estimated figure of 124.45 M USD. In the next quarter, revenue is expected to reach 133.86 M USD.
WTI net income for the last quarter is −30.58 M USD, while the quarter before that showed −23.36 M USD of net income which accounts for −30.88% change. Track more W&T Offshore, Inc. financial stats to get the full picture.
Yes, WTI dividends are paid quarterly. The last dividend per share was 0.01 USD. As of today, Dividend Yield (TTM)% is 2.35%. Tracking W&T Offshore, Inc. dividends might help you take more informed decisions.
As of Aug 2, 2025, the company has 400 employees. See our rating of the largest employees — is W&T Offshore, Inc. on this list?
EBITDA measures a company's operating performance, its growth signifies an improvement in the efficiency of a company. W&T Offshore, Inc. EBITDA is 124.34 M USD, and current EBITDA margin is 25.36%. See more stats in W&T Offshore, Inc. financial statements.
Like other stocks, WTI shares are traded on stock exchanges, e.g. Nasdaq, Nyse, Euronext, and the easiest way to buy them is through an online stock broker. To do this, you need to open an account and follow a broker's procedures, then start trading. You can trade W&T Offshore, Inc. stock right from TradingView charts — choose your broker and connect to your account.
Investing in stocks requires a comprehensive research: you should carefully study all the available data, e.g. company's financials, related news, and its technical analysis. So W&T Offshore, Inc. technincal analysis shows the sell today, and its 1 week rating is neutral. Since market conditions are prone to changes, it's worth looking a bit further into the future — according to the 1 month rating W&T Offshore, Inc. stock shows the sell signal. See more of W&T Offshore, Inc. technicals for a more comprehensive analysis.
If you're still not sure, try looking for inspiration in our curated watchlists.
If you're still not sure, try looking for inspiration in our curated watchlists.