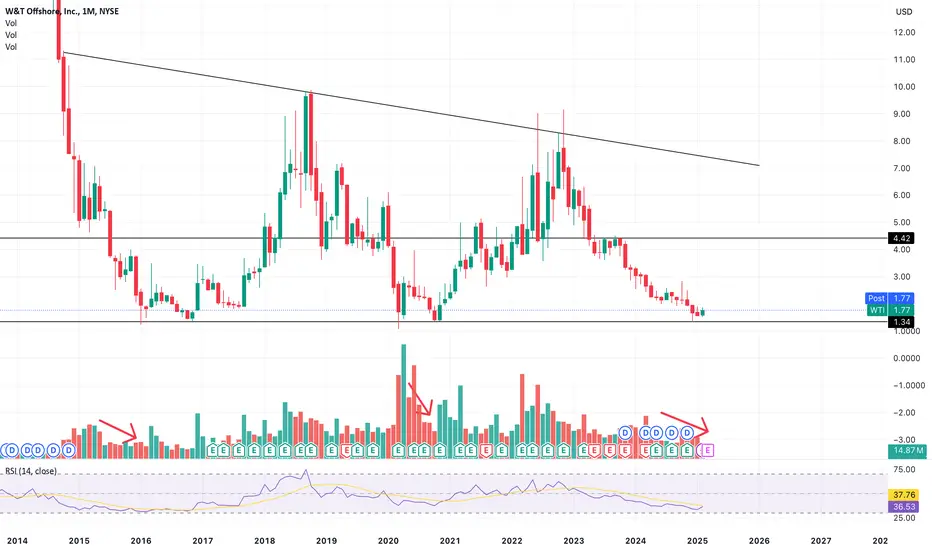
$WTI reversalI think we start to see a reversal now
Decreasing volume consolidation showing
RSI looks bottomed and primed for a bounce-back
Hit a really important level at $1.4 and bounced at multiple bottom
Long Term PT $7
Will take time, lets see what happens
WTI trade ideas
WTI may go uphi traders
WTI looks good here.
We are getting a bullish englufing candle on the weekly degree. It may be a sign of a trend reversal.
Around 4,40 $ we should see a strong resistance.
Looking for a pullback to enter long.
Entry, target and stop loss are shown on the chart

Crude Oil At Pivotal Resistance: Target $10Based on the current chart, it appears that BLACKBULL:WTI crude oil is approaching an inverse resistance level—a threshold it has decisively surpassed only twice before. The first instance occurred in 2015, a period influenced by OPEC's late 2014 decision to maintain production levels instead of cutting them, which would have bolstered prices. The second breach coincided with the onset of Covid during a time when roads were nearly void of cars due to global lockdowns. Now, as we navigate through 2023 with an economy in motion, those with an inclination for strategic investments might find merit in monitoring this zone for a potential long entry opportunity.
Long Target: $10 by March 2024


WTI headed under $4 again!Most time frames are oversold atm and shows price severely dropping as low as 3-4$ NFA but do set alerts and read the market again.

W&T Offshore: Holding Above Supply Line and SupportRight now WTI is breaking above the Supply Line of what looks to be some kind of Bump and Run Reversal Bottom at an Ice Line while forming somewhat of an Inverted Head and Shoulders Pattern. If this level holds we could see it go for the next major level of support/resistance all the way up at $44.57

OIL Moving up? WTI double bottomI got into this yesterday at $4.40 speculatively but we are holding and moving up so I thought I would share this trade. It looks like a good oversold condition on many time frames, sitting at support as well. Macd curling up potentially! I'd like to target that 200ma personally, then let some ride. Not financial advice, DYOR.

Sell to Open WTI Nov 18 2022 5 Put Limit at $0.05 (Day)Sell to Open WTI Nov 18 2022 5 Put Limit at $0.05 (Day)
End of the correction

$WTI - Power Earnings Gap Watch EntryWatching $WTI as a PEG Strategy. The latest drop in price appears to be headed to AVWAP from day of gap up. Watching for support.

WTI bounce areaWe are bouncing off a demand zone and fib retracement line.
Green zones are supply zones pulled from various time frames (daily, H8, H4, H1) ($5.5, $6.8, $7.4 are supply zone areas)
We could have a nice run into earning as USOIL futures corrected quite a bit and looks to be bouncing now.

WTI setting up for a breakout*WTI Setting up for a New 52 Week High
*Daily volume is more than double of average volume
*Taking full advantage of price appreciation in Crude Oil

WTI Breaking Out Well, I was not prepared for this to break out so fast. We still have a nice 5% scalp possible. NFA, DYOR

WTI Weekly Technical AnalysisWTI - Weekly - EDUCATIONAL only - Support, Resistance, Trend Lines, Fibonacci, Triangle, Cluster - Hope it Helps, Good Luck

WTI Crude Oil: oil declines after the release of the EIA reportCurrent trend
The North American light oil price, WTI Crude Oil, declines, currently trading around 70.70.
Yesterday, the US Energy Information Administration (EIA) published key statistics on the state of the domestic oil market. According to the department, commercial stocks for the week fell by 0.240M barrels to 433M barrels. The volume of imports of "black gold" increased by 0.329M barrels and amounted to 4.2M barrels per day, while its production increased by 0.154M barrels and reached 11.7M barrels per day, which is the year's record. It was also recorded that demand from oil refineries increased by 0.200M barrels and amounted to 15.6M. Strategic oil reserves decreased by 1.700M barrels and currently amount to 600.9M barrels.
Thanks to the entry into the market of additional volumes of energy from the US reserves, it was possible to compensate for a serious shortage of raw materials, leading to a smooth depreciation of the asset price soon.
Support and resistance
On the global chart, the price is correcting after a significant decline. Technical indicators keep a sell signal: the range of EMA fluctuations on the Alligator indicator, although narrowing, is still quite stable, and the AO oscillator histogram is forming upward bars, being in the sell zone.
Resistance levels: 72.70, 78.46.
Support levels: 69.18, 61.67.


WTI Crude Oil: growth amid data on reducing oil reservesCurrent trend
The price of WTI Crude Oil is increasing and is currently located at 82.92. The quotes are trading in an uptrend amid a decrease in fuel reserves in US warehouses by —2.485 million barrels against an increase of 3.594 million a week earlier. Additional support to the price is provided by the strong position of OPEC+ regarding the preservation of agreements on production levels amid constant pressure from the United States — the US government has been urging the organization to increase production levels for more than a month, referring to the fuel crisis and a significant increase in gasoline prices in the country. OPEC+, however, does not plan to change the previously announced course.
The US Department of Energy yesterday published a forecast for the energy market for the near future. According to the department, daily oil production in 2021 will increase by 80K barrels and may amount to 11.1 million barrels, and in 2022 production is expected to increase by 170K barrels per day (up to 11.9 million barrels). The Energy Information Administration also noted a significant increase in fuel prices caused by gasoline shortages. As a result, the United States had to increase oil production in October by 700K barrels (up to 11.4 million).
Support and resistance
On the global chart of the asset, the price is increasing within the next growth wave and is approaching the absolute maximum of the year at 84.96. Technical indicators began to strengthen the buy signal again: the fluctuation range of the EMA on the Alligator indicator started to expand, and the AO oscillator histogram formed an upward bar.
Resistance levels: 84.50, 90.00.
Support levels: 81.44, 78.00.

0030 WTI:xnys - Dip Strategy | StockDate : Wednesday 20th October 2021
Time of trade (Malaysia Time) : 23:32
Scanner : DDNK Bullish Finviz
Entry Price : $4.35
Shares : 1000
TP (Take Profit) : $4.87
SL (Stop Loss) : $4.21
*Prices are in $USD
Comments :
- What's on your mind? (What do you think about what you are doing/did?)
I wanted to do options, since it's so cheap, but there are no strategies that support options for now. So the dip looks good here.
- How are you feeling? (e.g. Energetic and well. Energetic and serabut? Unpleasant and uneasy? FeelsOkayMan etc...)
Okay, good. A chart is a chart is a chart.
- Any distractions on your mind? (Lawan ngan gf monkaS).
Nope.

WTI - Tight Falling Wedge Consolidation in a Wider H&S Bottom NYSE:WTI This is a nice set-up I trade aggressively. The bigger picture is a wide base, Head & Shoulder bottom. First break of the neckline was a head fake, as usual, the consolidation following the fake out is a tight falling wedge. I buy an initial line here and load up aggressively on a 2nd break above the neckline. NYSE:WTI

WTI Bullish ForecastTo trade with a stochastic alone is fun, it can be tricky but it is okay. It needs awareness of candlestick patterns and possibly good for day trading or scalping.
WTI for this one is bullish towards 4.36 on pullback.
.
Khiwe
At this profile page, the shared analysis, ideas and also, the strategy of a chart belong to Khiwe with some being influenced. The technical set-ups are speculative, they are not guaranteed for accuracy or in completeness in the form of any content; -it is not to advice on financial markets. Please apply your own analysis and confirm it with price action.

possibility for two targets2.16 and 7.50 i would say that if we see a return to covid protocol over the winter and being slower demand for oil consumption then we will hit 2.16 as we approach the spring of 2022 we will see an increase in demand reaching the top of wave three at 7.50.. this is my opinion, i am not trading energy at this time

$WTI Bearish Wolfe Wave?It seems like we may be in a bearish Wolfe Wave pattern here for the time being, I don't think the bullish pattern fits because our wave 3 is higher than our wave 1. Short term we could see a PT of up to 5.50 before a pullback to sub $3 but with the fib resistance at 5.06 we may see the pattern begin a turn-around there. Lets see!


US Stock In Play: $WTI (W&T Offshore Inc)With Oil and Gas stocks continue to rally up form their 2020 lows, and SPDR S&P Oil & Gas Exploration & Production ETF ($XOP) already above its Pre-Covid levels, $WTI rally of +24.06% over the past weeks of trading upon the high volume break of a two weeks consolidated pattern, continue to suggest it is playing catch up relative to the broader sector.
With management of $WTI owning 35% of the common stock, it provides a strong alignment of incentives. Its offshore's asset values alone suggest that the shares are underpriced and may be worth $6-$7.
The immediate resistance for $WTI is at $5.
$WTI an independent oil and natural gas producer, engages in the acquisition, exploration, and development of oil and natural gas properties in the Gulf of Mexico. The company sells crude oil, natural gas liquids, and natural gas. It holds working interest in approximately 43 offshore fields in federal and state waters. The company also owns interest in approximately 146 offshore structures.
