Wester Union Stock Qoute | Chart & Forecast SummaryKey Indicators On Trade Set Up In General
1. Push Set Up
2. Range Set up
3. Break & Retest Set Up
Notes On Session
# Wester Union
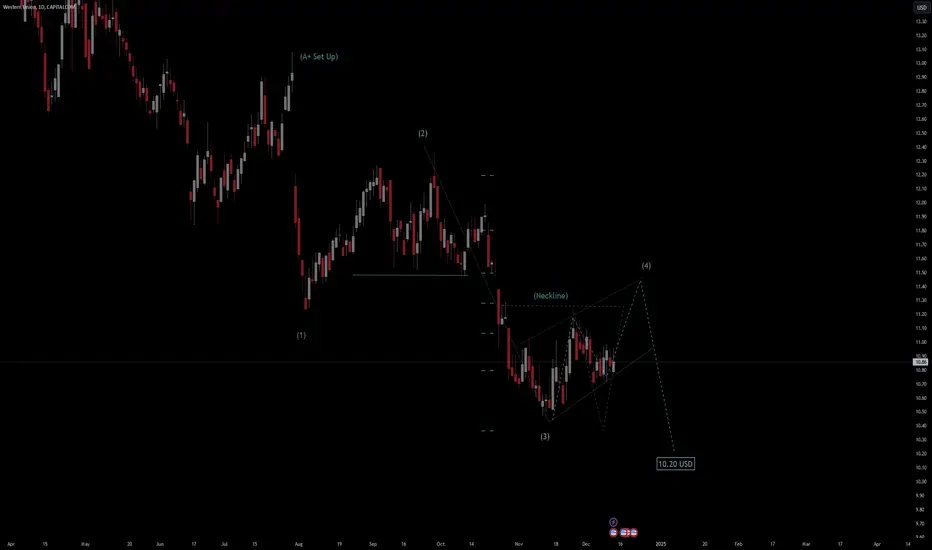
- Double Formation
* A+ Set Up At 13.00 USD
* 012345 | Wave (1) & (2) | Downtrend Principle | Subdivision 1
- Triple Formation
* Neckline At 11.25 USD
* Flag structure | 10.20 USD | Entry Condition | Subdivision 2
* Top / Bottom Structure | Reversed | Support Current Trend | Subdivision 3
Active Sessions On Relevant Range & Elemented Probabilities;
London(Upwards) - NYC(Downwards)
Conclusion | Trade Plan Execution & Risk Management On Demand;
Overall Consensus | Sell
WU trade ideas

Western Union is poised for upsideCup and handle has formed on the WU company since 7 March 2023.
During the time it's formed higher lows and has just broken above the Cup and Handle giving a conservative entry level.
Other indicators show upside to come.
7>21>200
RSI>50
Target R15.91

This Stock is Down But Its Up By +0.08%Short selling is a different style of trading
and doing it gives you a different mindset
--
As you watch online gurus most of them
will be short sellers
--
Because when you start trading your view
will be most likely of that of a short seller
--
This stock is up but when you pull back
to a weekly chart you will notice
--
That the overall market is in a downtrend
Because of the
1- Price
2-50 EMA
3-200 MA
--
These 3 things show you wether the
price is in a trend or not
--
In about 1 month or so come back to this chart
and press the Play button on screen to
see if this ''prediction'' was correct
--
or if really short selling is DEAD!!
--
Honestly if you love short selling then go for it!!
--
**Stock Trading Disclaimer**
The content provided here is for informational and educational purposes only and should not be considered as investment advice. The stock market carries a high level of risk and may not be suitable for all investors. Before participating in stock trading, it is important to carefully consider your investment objectives, level of experience, and risk appetite.
The information presented on this platform does not constitute financial, legal, or trading advice. Always seek advice from a qualified financial advisor or professional before making any investment decisions. Any reliance on the information provided is at your own risk.
Trading stocks involves a substantial risk of loss and is not suitable for everyone. Past performance is not indicative of future results. It is possible to lose more than your initial investment. Only trade with money you can afford to lose.
It is important to be aware of and understand all the risks associated with stock trading. You should not engage in trading unless you fully understand the nature of the transactions you are entering into and the extent of your exposure to loss. If you are uncertain about the risks involved, seek independent advice from a financial advisor.
The use of any trading system or strategy does not guarantee profits, and no system or strategy can guarantee against losses. You should be aware of the risks associated with using any third-party trading system or strategy and carefully consider whether such trading is suitable for you based on your financial situation and risk tolerance.
The owners, authors, and publishers of this platform are not responsible for any losses incurred as a result of any trading decisions or actions taken based on the information provided. They do not assume any liability for any financial losses.
By accessing this platform, you acknowledge and agree to the terms of this disclaimer. It is recommended to review this disclaimer periodically for any updates or changes.
---
Please remember that this is a generic example and should not be considered as legal advice. If you are setting up a stock trading platform or providing stock trading services, it is advisable to consult with a legal professional to ensure that your disclaimer complies with local regulations and provides the necessary protections.
---
Rocket boost this post to learn more

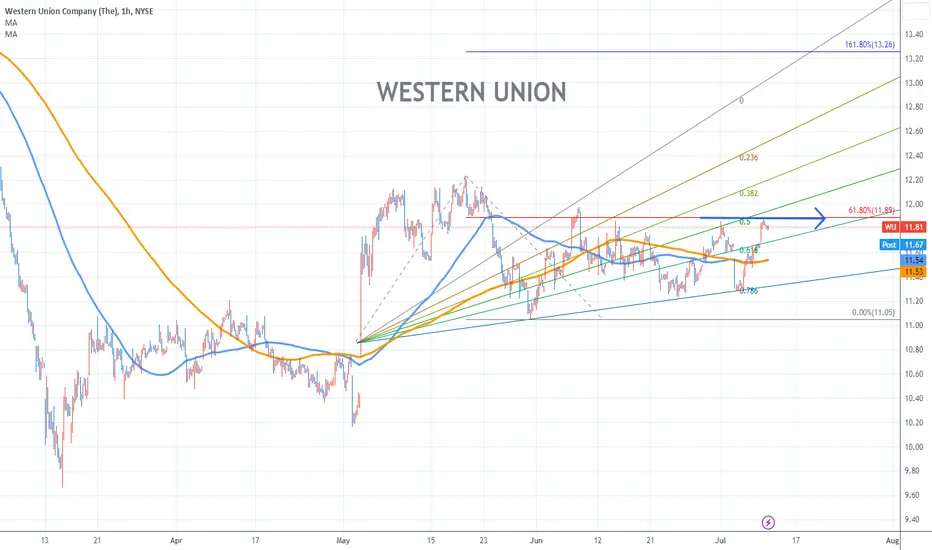
WESTERN UNION Stock Chart Fibonacci Analysis 071123 Trading Idea
1) Find a FIBO slingshot
2) Check FIBO 61.80% level
3) Entry Point > 12/61.80%
Chart time frame : B
A) 15 min(1W-3M)
B) 1 hr(3M-6M)
C) 4 hr(6M-1year)
D) 1 day(1-3years)
Stock progress : B
A) Keep rising over 61.80% resistance
B) 61.80% resistance
C) Hit the bottom
D) Hit the top
Stocks rise as they rise from support and fall from resistance. Our goal is to find a low support point and enter. It can be referred to as buying at the pullback point. The pullback point can be found with a Fibonacci extension of 61.80%. This is a step to find entry level. 1) Find a triangle (Fibonacci Speed Fan Line) that connects the high (resistance) and low (support) points of the stock in progress, where it is continuously expressed as a Slingshot, 2) and create a Fibonacci extension level for the first rising wave from the start point of slingshot pattern.
When the current price goes over 61.80% level , that can be a good entry point, especially if the SMA 100 and 200 curves are gathered together at 61.80%, it is a very good entry point.
As a great help, tradingview provide these Fibonacci speed fan lines and extension levels with ease. So if you use the Fibonacci fan line, the extension level, and the SMA 100/200 curve well, you can find an entry point for the stock market. At least you have to enter at this low point to avoid trading failure, and if you are skilled at entering this low point, with fibonacci6180 technique, your reading skill to chart will be greatly improved.
If you want to do day trading, please set the time frame to 5 minutes or 15 minutes, and you will see many of the low point of rising stocks.
If want to prefer long term range trading, you can set the time frame to 1 hr or 1 day.
Western Union: Inverse Head and Shoulder Bullish Gartley EntryWe have what could be a Bulliish Gartley entry at the Right Shoulder of an Inverse Head and Shoulders pattern that lines up with an all time 61.8% Retrace if we bounce from here i'll be targeting the square up.

Trade To 19.35 18.46 Western UnionBuy and sell to 19.35 Gap. Trending upwards towards there or more. 7.6%

WU - weekly pennant breakoutThis can be a nice financial value play. March / Jan'23 calls on this. 20+ bucks price target. Pays dividend so can be nice for commons. Options aren't too bad on it. Nice set and forget in my opinion. Stock is trading cheaply at around 10 P/E.

WESTERN UNION Weekly Technical AnalysisWU Weekly - EDUCATIONAL only - Support, Resistance, Trend Lines , Clusters, Fibonacci Retracement/Extension , Parallel Channels - Hope it Helps, Good Luck

A Potential Bearish on Western UnionWestern Union shows an extreme divergence for bearish reversal, to continue its bigger trend. Here shown, Western Union move under the EMA 200. It could be a sign that Western Union in still on a bearish trend.


Buy $WU - NRPicks 12 NovThe Western Union Company provides money movement and payment services worldwide. It operates in two segments, Consumer-to-Consumer and Business Solutions. The company also offers bill payment services that facilitate payments from consumers to businesses.
Revenue TTM 5B
Net Income TTM 800M
EBITDA TTM 1.2B
EBITDA margin TTM 25%
Debt/EBITDA TTM 2.28x
P/E 9.01
P/S 1.41

wu buybuy after the break .. first target 21.00 .. finally target 24.00 ...stoploss under the support level


Technical analysis (WU)The Western Union Co. (WU)
Limit buy - 17,90
Target - №1-21,35$ №2- 23,10$
Risk/Reward Ratio - 3,63
Stop-loss - 16,95

fundamental analysis (WU)Limit buy - 20,30$
Target - 22,65
Risk/Reward Ratio - 4,27
Stop-loss - 19,75

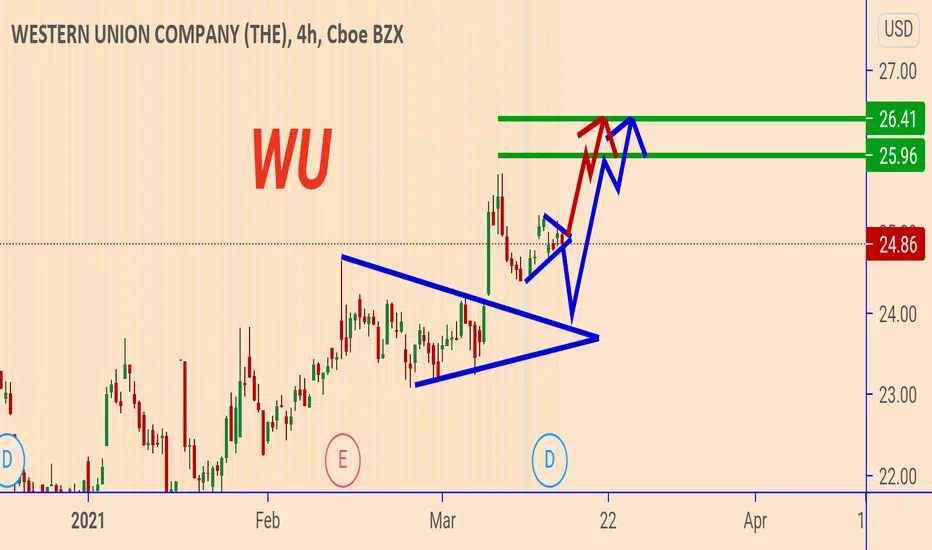
WU: Western Union - Ascending ChannelThe price is moving very well inside an ascending channel. Now we can see a retest of the previous support zone again giving us in this way a buying opportunity again.
Buy zone: $24 - $24.20
Targets:
$25.76
$26.41
Thank you and Good Luck!

WU: Update - Ascending ChannelAscending Channel
Buy zone: $24 - $24.20
Targets:
$25.76
$26.41
Thank you and Good Luck!
Base idea:

WU: Update -Trading Inside The ChannelTrading Inside The Channel
Buy zone: $24 - $24.20
Targets:
$25.76
$26.41
Thank you and Good Luck!
Previous analysis:

WU: Update 1: Two Possible ScenariosWU usually is a slow mover but it's good for lomg term investors because of the divident income.
Next Dividend Date was 16 Mar 2021 (Tue) and the Pay date is 31 Mar 2021 (Wed).
Targets:
$25.96
$26.41
Thank you and Good Luck
the b[AI]te's weekly insights -- WU 2021-03-15center stage attention
stock
our system found that WU received most attention over the course of last week.
comment image
we see a weak positive correlation with our image indicator. We therefore assume that prices are driven by facts rather than emotions and reflect an accurate picture of the companies current state of affairs.
new free tool
we launched our new free analysis tool. Check our website and test it out!
new free and powerful data API
you can now access our data via our free API . Check our website and test it out!
FAQ
ATTENTION
our algorithms define ATTENTION as the overall number of stories and opinions that appear for a given security each day.
IMAGE
our algorithms define IMAGE as the averaged sentiment value extracted from all opinions received for a given security per day. NYSE:WU


Western Union under the scopeThe money transfer company, has posted a consistent growth in its earnings over the past year. 4 days ago, it broke the main resistance level of 24.20$ and went up before hitting a roadblock at 25.26$ level. We are looking for a pullback to 24.20$ to initiate a long position.
