Rockfeller's Empire Strikes Back - Black Gold vs 01001001XOI oil index vs Nasdaq. Most hated vs Most loved (seems tide is turning for both)
Weekly RSI on this ratio unheard of 9 in April 2020.
I will always remember the great Kennedy Gammage of the Richland Report
talk about the cyclical shift between paper assets and hard assets.
That was in the 1998-2000 time frame when Gas was a $ at the pump and gold was selling for a few hundred bucks,
the Nasdaq was floating like a butterfly and stinging like a bee.
Sure looks like that shift is taking place again. In the fed we trust - "It's only transitional"
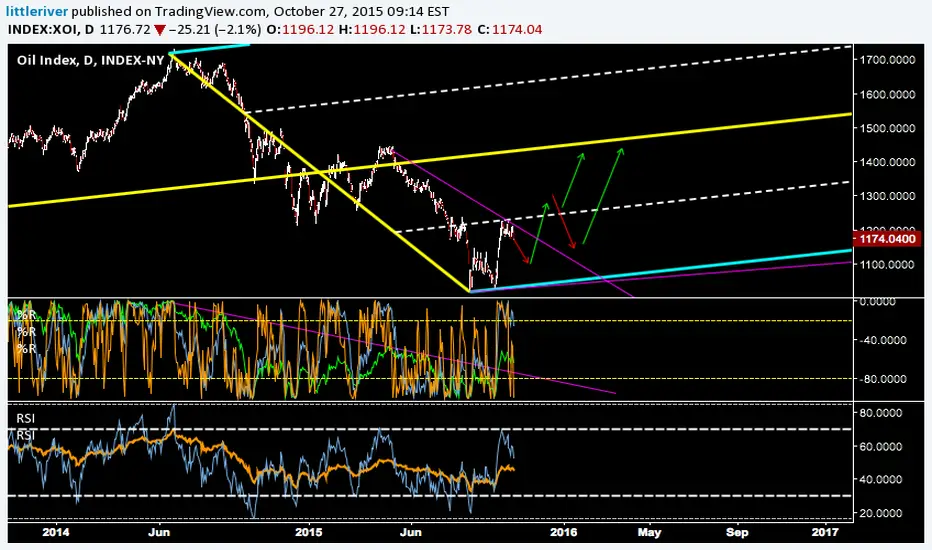
XOI trade ideas

XOI Index - Double Bottom
Double Bottom, Neckline retest. RSI Support.
BACA 1050, on SHS failure validation.

xoigood a spot as any for an entry into oil/gas stocks, maybe the us dollar going to dump? Eurozone doesn't like higher Euro either just as usa hates high dollar for debt repayment....New i phone but who can afford ???

OIL index at critical point: updateThis is a follow up from my April post. (see link below if interested).
The target I had has been hit. We had a reversal candle today so far. So check after the close.
The low recently touched but did not go below the level "a or 1"(754) . If it does near term it would likely indicate that all this the up action is a correction. If it does not and price goes above the current near term downtrend line then likely we have more up action ahead.
I trade this with the XLE ETF. I went long today. Personally I will use a close below 754 as my stop. Process your way.

Follow on OIL Gas Index with near term target In the last few weeks the OIL and Gas Index has risen even though crude dropped again despite the agreement of major producers to soon start cutting production by 10%.
The gain Friday is encouraging that the rise has further to go. If this is just part of a upward correction a likely target is given. If it quickly starts down again to complete a downward correction the stops I am using are shown on the daily chart. Personally I thing is part of a basing for a major longer term rise given the degree of drop since 2007. (see link for longer term chart).
This is just my opinion. Process your way.
Feedback always appreciated.
Take care. Have a great weekend.

OIL and Gas Index: Close to a bounce? IF this count is correct we could be at a temporary or even possibly a long term bottom. I have two "B " , if the 2nd one (B?) is the correct one then may have more drop to the .84 retreat. Must watch the price action the next couple of weeks for comfirmation. Process you way.
Have a great week.


XOI Oil Index 4/11/2016Oil has an oversupply problem so it may not go up as much as some of the other commodities, but it should still go up because USD will go down more.

XOI downhill predictionOne can easily see the triple mountain peak that occurs in november and decemeber and it seems to me that we are in the process of forming another. Look for a notable drop in the circled area.

A Crude Bottom Using this crude index chart to forecast one possible scenario in crude. A confirmed double bottom has formed and retrace in crude is taking place now. Crude may retrace to 40.60 a barrel before the next bull wave. This wave will break the downtrend line and confirm the IHS taking shape now. It may be followed by one last bear raid before the final bull push to the yellow median line.
CURRENCY VS COMMODOTY CORRELATION - CHECK THIS OUT Hi All, I was asked to provide you with some information regarding the affects of Commodity and Currency Correlation. Please read the chart notes so you can create and review and currency vs any commodity your self. You can compare and symbol/instrument.
Predicting the next move in the markets is the key to making money in trading, but putting this simple concept into action is much harder than it sounds. Professional forex traders have long known that trading currencies requires looking beyond the world of FX. The fact is that currencies are moved by many factors - supply and demand, politics, interest rates, economic growth, and so on.
More specifically, since economic growth and exports are directly related to a country\'s domestic industry, it is natural for some currencies to be heavily correlated with commodity prices. The top three currencies that have the tightest correlations with commodities are the Australian dollar, the Canadian dollar and the New Zealand dollar.
Other currencies that are also impacted by commodity prices but have a weaker correlation are the Swiss franc and the Japanese yen. Knowing which currency is correlated with what commodity can help traders understand and predict certain market movements.
On this chart you can see
1. Green - XAUUSD
2. Yellow - NZDUSD Currency
3. PINK - AUDUSD
4. ORANGE - USDCAD
5. MAIN CHART - OIL INDEX INDEX-NY
Hope this helps so you can look at any of your choices to compare.

Another example of using Heiken Ashi as a triggerElliott waves can be an art form as much as a technical tool. On this oil trade, I'm not sure what the larger degree waves are. I can see motive waves down and I can see the possibility of a diagonal. A diagonal is a motive/corrective hyrbid that subdivides into three waves instead of five. Perhaps its just a large zig-zag.
But regardless, the correction on this chart seemed to me like a flat formation in a larger 2 or B wave. When it seemed to complete, I waited for the red Heiken Ashi bar down. The MA lines were not yet sloping down on entry, so I took a chance here without confirmation. The trigger to liquidate would be a green Heiken Ashi bar, but I couldnt resist taking profits today :) It was a good result. The down trend seemed to coincide with a strong dollar rally. I will wait for a pullback before considering the next entry opportunity. I don't play every time the heiken ashi bars change color, only when they do so in favor of my primary wave count.
If anyone is interested in Elliott waves, I recommend the book: ELLIOTT WAVE PRINCIPLE by Frost & Prechter. Its a definitive work on the subject.

possible medium term reversalI am paying close attention to this index.
If price breaks the kumo (depending on what happens with the break and where price is
related towards a resistance area) then this index may gain some momentum towards a
medium term support.

XOI (Oil Index). Potential reaction.Symmetrical Triangle brake_out, measured target
may have been reached, in the short term.
'Irregular' Wolfe Waves 5 crosses.
Large ABC wave. 1-4 Line support.
Bullish Hammer rejection on 2012 Uptrend_line,
61.8% retracement, horizontal support (2013).
RSI Oversold. potential AB=CD.
Target_1 : 1542


expected price formationofc this prediction can fail since D is not complete but I expect to happen something like that
