YELP trade ideas

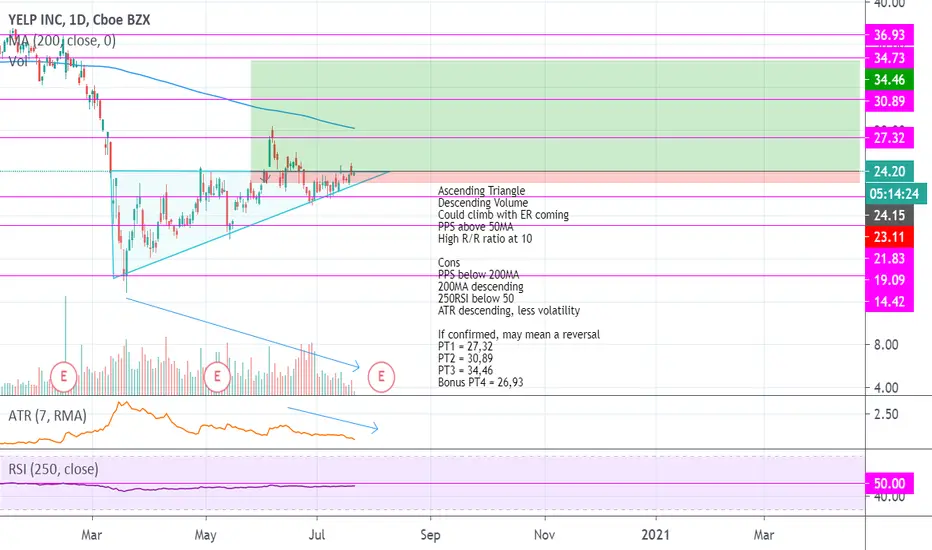
YELP: Ascending TriangleAscending Triangle
Descending Volume
Could climb with ER coming
PPS above 50MA
High R/R ratio at 10
Cons
PPS below 200MA
200MA descending
250RSI below 50
ATR descending, less volatility
If confirmed, may mean a reversal
PT1 = 27,32
PT2 = 30,89
PT3 = 34,46
Bonus PT4 = 26,93

YELP TriangleHave been watching this YELP triangle forming the past few days. Neutral sentiment right now. Technically the trend looks down, but ready to buy on breakout from the top trendline or short on breakdown from the bottom trendline. We don't have to choose a side in advance. Let the market show us, and be ready to take action.

YELP 1W DESCENDING TRIANGLE SHORT TRADEDescending Triangles are repeatable trading chart patterns.
Descending chart patterns will have a directional bias depending on the previous incoming trend.
Each chart pattern will have defining trendlines of the support/resistance levels creating the pattern.
What ever time frame you are trading this chart pattern, wait for a candle close outside of the trendline in the direction of the breakout candle. (Our time frame preference is the Daily chart).
Add volume indicator - Volume is the amount of $ that went into a particular candle or in Forex the # of trades that took place.
Add ATR indicator - Volatility is the amount of price movement that occurred. Use the ATR to measure the price movement.
When you see descending Volume bars and descending ATR line (which indicates volatility) this shows
a dis-interest in traders to invest in this pair creating consolidation which creates the chart pattern.
Trade Management after there is a breakout candle close.
1 - Position size (compare volume bar to volume ma line).
a - Breakout candle must be 100% of average volume for a full position size.
b - If 75% of average volume then ½ position size. (To find 75% of Volume
look at the charts volume settings – divide smaller # into larger # = 75%+)
2 - Enter two trades.
3 - SL for both trades will be 1.5 x ATR.
4 - 1st trade TP will be 1 x ATR.
5 - No TP on 2nd trade – letting profit run and adjusting SL to follow price.
6 - When 1st TP hit – move 2nd trade SL to breakeven.
7 - Adjust the 2nd trade SL to follow price.
*8 – After Breakout candle – if price closes back into chart pattern close trade
*9 - When breakout candle is more than 1 ATR from breakout candle open.
a - Enter 1st trade at candle close with ½ position size.
b - Enter 2nd trade with a pending limit order that is 1 ATR of breakout candle open.
c – Price should pullback to that pending limit order for 2nd trade.
d – If Price returns back into chart pattern close trade before SL is hit.

YELP Bearish triangleYELP is displaying a bearish triangle pattern, which will lead to downsides. However rising MACD is contradictory to this analysis and suggests that momentum is moving upwards. Time will tell what we see from this.

Earnings Analysis YELP is facing strong resistance ahead of its earnings.
The Stock's price is below 35-36$, which is a strong weekly Zone that includes the weekly downtrend line and 3 weekly MA lines (including the 200 weeks MA line).
The scenarios:
- Bearish:
If YELP will remain below the current Resistance Zone (probably will gap lower), it can slide all the way down to complete a bullish harmonic pattern (Gartley), near 22$ - Remember this is a weekly chart so it can take weeks/months
- Bullish:
If YELP will have positive earnings that will boost its price above the 200 weeks MA line (and stay above), a potential scenario is that it will climb to complete a bearish Bat near 50$ - Again, this can take weeks/months.
It looks like the earnings will generate a strong move anyway - So, for you options traders...

"Joe's Earning season preview" EP04 --DIS,MNK,ATVI,UBER,and JACKHi everyone, after a week off I'm back to the stage!
There are still plenty of names that are going to have their earning report this week.
Again, this series is more about "How I check up names during earning season" rather than focusing on some specific names or plans.
Mon: MAR, SHAK, TSN, TTWO
Tue: FIS, MNK, DIS
Wed: DDD, AIG, BKNG, JACK, LYFT
Thur: ATVI, DBX, UBER, YELP
Let's see how they go yo!


YELP still in need of a lot of HELPProbably the most noteworthy thing to say about YELP is that it will soon be involved in an antitrust case against Google, that alone gives an indication of how poorly the business model can contend with competition. Expectation are very low in the stock and the options market is signalling more pain ahead, until that downtrend is broken its short all the way. Considering the lofty P/E ratio there is definitely much better places to put your money.
AVERAGE ANALYSTS PRICE TARGET $38
AVERAGE ANALYSTS RECOMMENDATION Hold
P/E RATIO 50
SHORT INTEREST 11%
COMPANY PROFILE
Yelp, Inc. hosts an online database of user-generated reviews of local businesses. It provides reviews on local businesses, which include restaurants, boutiques and salons, dentists, mechanics and plumbers. The firm offers multiple free and paid advertising solutions to engage with consumers, including free online business accounts, search advertising and Yelp Deals. The company was founded by Jeremy Stoppelman and Russell Simmons in July 2004 and is headquartered in San Francisco, CA.

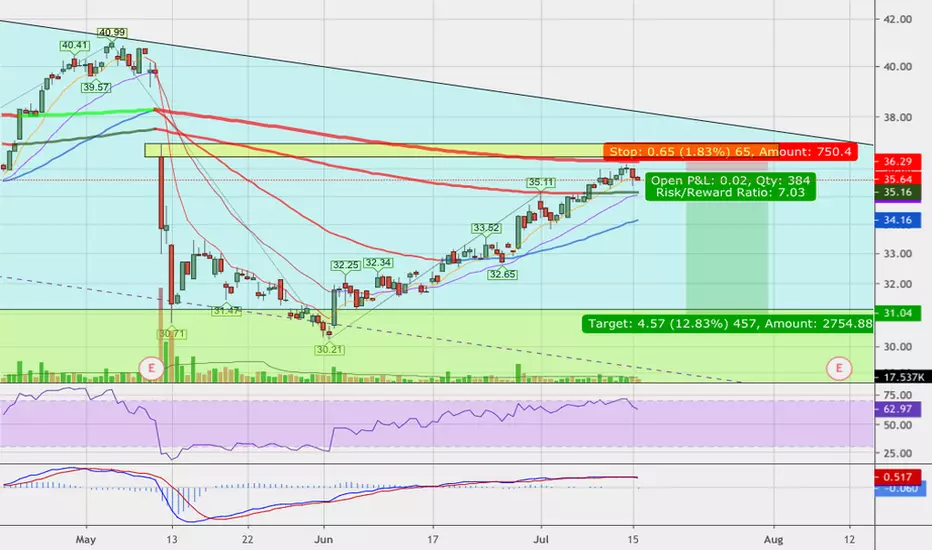
Great Buy For YelpYelp has a consistent upward trend on the one hour chart and about to confirm upward trend on the 4 hour chart based on the 180 day EMA. Great potential for an east 5-10% return on a strong company.

YELP IV spikes in mid-July and mid-August contractsPrice climbing and contracts on the call side. Looks promising.

$YELP YELP NEEDS HELP. Despite any upgrades we see nothing that would compel us to go long in this stock. It has had a lot of volatile moves and we believe more will happen in the not to distant future, but in a downward fashion.


YELP: Building my short position as I turn negative in the mktBeen eyeing on this and did pull a trigger. Opened this:
Apr 12th -- 36 puts
No escape for this. 100% sure.

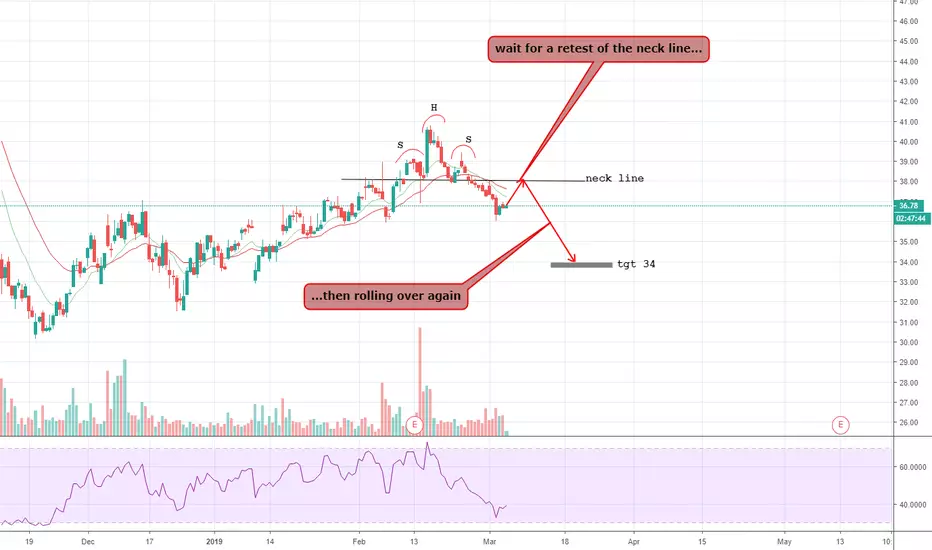
YELP - retest the neck line before rolling overH&S pattern has been completed.
Now, wait for a retest of the neckline before rolling over again.
Target: 34


YELP IN FLAG PATTERN?11/5 - OPINION - Looks like a BUY opportunity,
does YELP need to retest $41.90 ??
MACD crossing north +
RSI (49.2550) looks poised for a buy
10 EMA about to cross north over 20 EMA
*Let's see what happens!!!
*DISCLAIMER - I am not a professional trader, these are merely my views, thoughts, and opinions. Please seek professional advise in your investments.

YELP - Targets to look at Here are some targets to trade too.. This is waaaaaaaaaaaay below any long term moving average so you need to be looking at some really hard pivots here. The weekly chart is the only one that shows some. Trade with a tight stop on this one and get out when targets are met.
