ZETA trade ideas
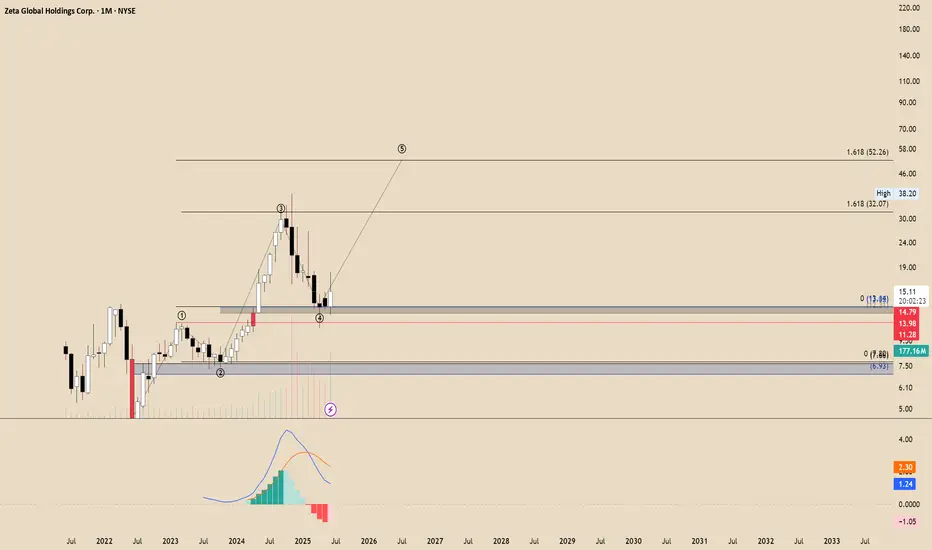
ZETA wave 5?Zeta appears to be forming the structure for a final Wave 5 (Elliott Wave Theory). Why? Let's analyze: Wave 2 showed only a shallow retracement, falling between 38–50%. However, Wave 3 extended to 1.618, indicating strong momentum. The Wave 4 pullback did not invalidate Wave 1 (as confirmed on the line chart – monthly timeframe). Additionally, the MACD is showing convergence and providing bullish momentum.
As commonly understood, for Wave 5 to validate the Elliott setup, it must extend beyond the peak of Wave 3. Therefore, projections to 0.618 or even 100% of the previous impulse may not suffice to confirm this pattern. This leads to the conclusion that an aggressive extension to the 1.618 level is more likely.
NFA

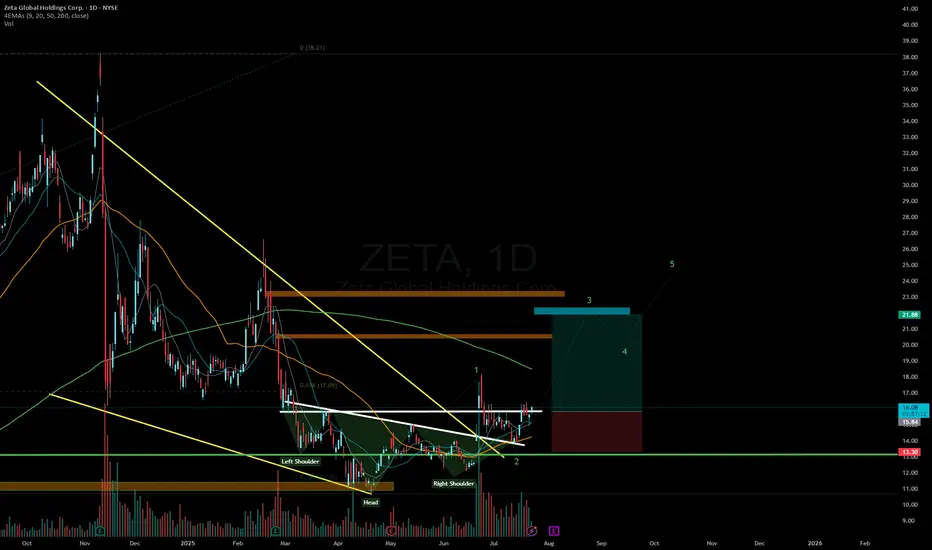
ZETA: when a wedge isn’t just a wedge — it’s a launchpadTechnically, this setup is textbook clean. Price completed the fifth wave within a falling wedge and instantly reacted with a bullish breakout. The expected breakdown didn’t happen — instead, buyers stepped in, confirmed by rising volume. All EMAs are compressed at the bottom of the structure, signaling a clear shift in momentum. The volume profile shows strong accumulation around $14, while the area above current levels is a vacuum — ideal conditions for acceleration.
The key resistance zone is $16.70–17.20 — former base highs and the 0.236 Fibonacci retracement. If price breaks this area with volume, the next stop is likely $24.48 (0.5 Fibo). Classical wedge targets land at $38.28 and $55.33 (1.272 and 1.618 extensions). If a trending leg begins, it could move fast — because there’s simply no supply overhead.
Fundamentals:
ZETA isn’t a profitable company yet, but it shows consistent revenue growth and aggressive expansion. Capitalization is rising, debt is manageable, and institutional interest has increased over recent quarters. In an environment where tech and AI are regaining momentum, ZETA could be a speculative second-tier breakout candidate.
Tactical plan:
— Entry: market or after a retest of $14.00–14.30
— First target: $17.20
— Main target: $24.48
— Continuation: $38.28+
— Stop: below $13.00 (bottom wedge boundary)
When the market prints a wedge like this and the crowd ignores it — that’s often the best trap setup. Only this time, it’s not for retail buyers. It’s for the shorts. Because when a falling wedge breaks to the upside with volume — it’s time to buckle up.

ZETAZETA
Description:
- Marketcap: 2.5B
- Float: 184M (medium)
- ATR 52W: 27%, 24M: 45%, 12Q: 60%
- Correlation with SP500: 83.34% (200D)
- Betta: 1.42 (200D)
- Relative Strength: 2.24 (200D)
Fundamental picture
- Revenue: Growing with increasing rate
- EPS: Negative but becoming better
- Stock was previously diluted by 1%-7% (annually)
Technical picture:
- Current price - 11.63, Drop by 70% from ATH
- Volume profite: Price is inside empty area, center of VAL
- Formation:
- Oscillator: Potential reversal on weekend with divergence
- Support: 10, 8, 6
Upside: 300%
- Market is 18-33-44 (low-consensus-high)
- Trend: 50
- Volume Profile: 21 (VAH)
- ReHigh: 40
Downside: 50%
- Market - 18
- Trend / Spikes: 10-13
- Volume profile - 8.5 (PoC), 6 (VAL)
- Time: 4 (2022)
Execution
- Await start of buying

$ZETA will continue to climb up > $30 - Ignore FUD, accumulate like the whales 🐋
- Zeta Global Holdings Corp. (NYSE: ZETA) reported robust financial performance in the third quarter of 2024, with revenue reaching $268 million—a 42% year-over-year increase.
STOCK TARGET ADVISOR
- This growth underscores the company's strong market position and effective strategic initiatives.
- Analysts have responded positively, with Needham & Company LLC reaffirming a "buy" rating and setting a price target of $43.00, suggesting a potential upside of approximately 99.81% from the current share price.

2/25/25 - $zeta - a lil EPS bingo2/25/25 :: VROCKSTAR :: NYSE:ZETA
a lil EPS bingo
- i'm aware of the bear/ culper write up and tend to believe it
- i also witnessed NASDAQ:APP go bananas (and that one is a total banana fr4ud too)
- nevermind a ton of NYSE:ZETA stuff is email related, and we saw $kyvo post good results
- all the ad/ data related stuff
- i'm only ATM C's
- keeping it small
- rough tape
- but it's a type of name where upside could be kinda stupid (downside too - hence the C's not outright shares)
- play a lil bingo.
V

ZETA bullish breakoutZEta has finally broken out from its long running bearish flat trend and broken its daily range
Lets see if it goes above 200 MA which will confirm the bullish reversal and entry at 23/24 would be great entry to catch the train to 30+

ZETA reversal ZETA recently suffered a short attack on its earnings which were amazing
The short attack made Zeta dropped a lot making it a very cheap stock to own.
After the short attack was over and the cloud was cleared Zeta is now moving very quickly towards its ATH .
Zeta has bounced off really nicely from its 200 SMA and 50 SMA
Entry : Now ( 25-27)
Stop loss : 19

ZETA double bottomZETA made a double bottom. It also made higher lows, which suggests the trend change. I like this setup a lot. If the volume comes in that will confirm the trend change.

Zeta Global Holdings Corp.Price Action :
The stock has been in a strong uptrend, as indicated by the consistent rise in prices over the last few months.
The most recent candle shows a significant bullish move, with the price closing at $26.85, a +7.92% increase on the day. This breakout may indicate bullish momentum continuing in the short term.
Moving Averages :
Bollinger Bands are plotted in this chart. The price has recently moved towards the upper band, suggesting bullish strength. When prices touch the upper band, it often indicates that the asset is overbought in the short term.
The middle band of the Bollinger Bands (typically the 20-period moving average) is also trending upwards, reinforcing the idea of a bullish trend.
The lower Bollinger Band is far below the current price, indicating a large deviation between price and the lower end of the volatility range, further signaling strong buying pressure.
Volume :
The volume for the current breakout day appears elevated compared to the previous trading sessions, confirming the strength behind the price movement. This surge in volume can signal that institutional investors or large market participants are involved.
Key Levels :
Support: The middle Bollinger Band (~$23.50) and recent consolidation levels around $24 could act as support levels.
Resistance: The high near $27.39 might act as a psychological resistance, especially as the price nears $28.
Outlook :
The overall trend is bullish, with rising price action supported by strong volume.
Given that the price is near the upper Bollinger Band, some consolidation or retracement could occur, but the general trend remains upward. Traders may look for a pullback to the middle band or a breakout above the recent high to confirm continuation.

ZETA GLOBAL HOLDINGS CORP - [ZETA]Trend Analysis :
Uptrend: The chart indicates a strong uptrend, with prices making higher highs and higher lows consistently from February to August. The uptrend appears to be intact, as the latest candles are still trading above key moving averages.
Support and Resistance Levels :
Resistance: The recent high around the $25.53 level serves as a short-term resistance. The price might face selling pressure around this level.
Support: The price seems to have strong support around the $23.00 level, where it previously bounced off, indicating buyer interest around this level.
Candlestick Patterns :
The recent candles suggest bullish momentum, especially with the strong green candle on the far right, indicating a +5.58% move. This suggests that buyers are currently in control.
Bollinger Bands :
The Bollinger Bands (red and green lines) are expanding, which generally indicates increased volatility. The price is approaching the upper band, which can sometimes act as resistance, leading to potential consolidation or pullback.
Volume Analysis :
The volume on the recent green candle is higher compared to the previous days, which adds strength to the bullish move. Higher volume on up days is a positive sign for continuation of the trend.
Potential Actionable Signals :
Bullish Signal: A break above the $25.53 resistance level with sustained volume could indicate a continuation of the uptrend.
Bearish Signal: If the price fails to break the resistance and drops below the $23.00 support level, it could signal a potential short-term reversal.
Conclusion :
The overall analysis suggests a bullish sentiment with strong upward momentum. However, the resistance level at $25.53 is critical, and a breakout above this could further strengthen the uptrend. Conversely, failure to break this resistance and a subsequent drop below the $23.00 support might indicate a potential reversal or consolidation phase.

ZETAThis is the clear example of the 52-weeks high strategy. Breakout of the key level and simple two entries as shown on the chart.
I bought this stock recently, after the retest of the corrective trend line after a local zigzag.
Will not keep it for a long time, will ride the local impulse up.
Trade safe

(Zeta) 3M Strategic Sync (Sell) Trend Analysis:
5/28/24
market trend high @ (+7.5%/18.26 (SBS DEV TP)) market declines from this point continues through +3.9%/$17.55 (SBS DEV 1H TP) & +1.5% / +0.9% TP's. expect
Expect declining trend to continue to fill in decline gap Next expected TP = -3.9% / $16.33
Scenario Analysis:
5/28/24
Continue decline to -0.9% / $16.84.
*(expect to widen risk management @round this area due to directional bias uncertainty... $16.84 area)
continue decline to $16.33 / -3.9% area
may see short-term (0.30% - 0.65%) retracement (inclined) @ $16.84 area before decline continuation
Objective & Targets:
5/28/24
Continue decline to -3.9% / $16.33
expect retrace close to 70% then continue decline ... @ $16.84

ZETA - Danger Mouse Short 💣💥ZETA
Ok i've got a silly short here but it has good bang for buck and tight RR 😅.
The point of this is twofold:
1) Indexes are at a potential ratio based inflection point (though not at all determined)
2) ZETA is also in a similar ratio based inflection point; though the chart is very different.
ZETA is up 19% today on TradingView "Gap Gainers" after an earnings pump.
And that has left an enormous gap.
This may prove to be an Exhaustion Gap as part of a blow off top.
From July 2022 we have a clear 3 wave structure.
And 3 waves often lead to a reversal.
Current price is close to the 0.786 overshoot ratio of the 1:0.618 Golden Window.
If it tops here then this is a weak extension ratio; because the third wave is shorter than the first.
And it is also in the reverse extension 1.618 Golden Window taken from wave 2 of 3 - the connective wave.
So this is a higher probability area for a pivot for the chart to maintain ratio balance.
Both overshoot ratios; the 0.786 and 1.786 are only just above current price and so this allows me to enter a short position with invalidation only a little way above.
Therefore I can reduce risk and increase margin.
If it does top out in this area then it can become a Shakeout Reversal Pattern ("S") above ATH resistance.
This is an area of higher liquidity and so is more likely to print a major pivot.
A weak extension ratio tends to lead to a minimum 0.618 retracement...
So this could go really deep - perhaps down to $7.
This may depend on what happens next with indexes, but if they also print a pivot into a bearish wave, then this is primed to go tumbling down and down 👍.
Not advice

SEIIV Studio's (Zeta) bull strat (buy)Expecting market to stay above average @ $12.81.
TP1 @ (0.5% / 0.7%) expecting continuation @
(TP1 to tp2@1.3% = target) expect to go to 1.7% thereafter if significant incline drags market to create higher highs EUR CPI looks promising to help uphold structure of market

ZETA - breaking of the rising wedge, bearishZETA looks like it formed rising wedge which started breaking down.
Good short set up / entry here.


Zeta Moving up slowly but surely. Nice consolation the. Swift moves up. Support 10.04. Descending trinagle. So flat support can be bearish but we have had multiple contiuation up. Either buy 10.04 support stops below or wait for break above 11

US Stock In Play: $ZETA$ZETA one of the few technology names that has an intact uptrend since the start of 2022.
above all KMAs while undergoing 4 weeks of consolidation within a bullish pennant pattern.
further price tightening will see all KMAs coiling into the pennant for an imminent breakout
