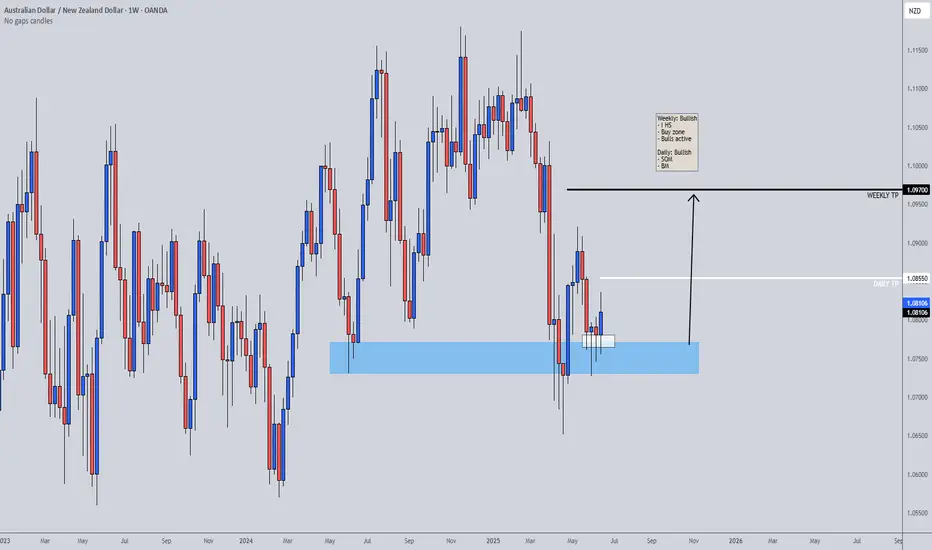
AUDNZD 01/07/2025Weekly:
-Inverse H&S pattern.
-Previous week low liquidity sweep.
Daily:
-Inverse H&S pattern.
-Bullish M pattern.
4H:
-Inverse H&S pattern.
-IC.
TradingView
NZDAUD trade ideas

AUDNZD new bullish expected
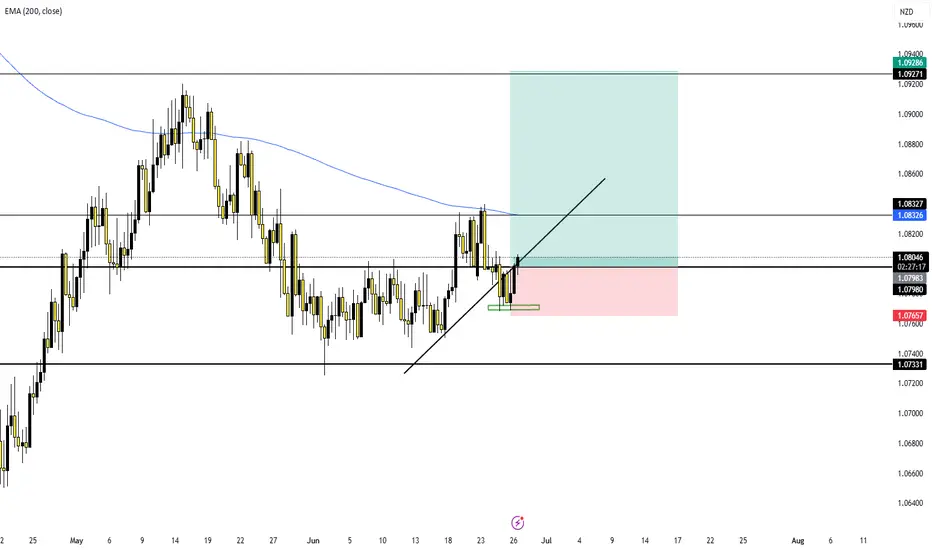
OANDA:AUDNZD price on trend line, above is ASCENDING TRIANGL, currently is breaked, 1.08000 crucial zone breaked, price pushing strong bullish and technically how looks, its for expect still bullish.
SUP zone: 1.07950
RES zone: 1.09400

AUDNZD 30/06/2025Weekly:
-Inverse H&S pattern.
-Previous week low liquidity sweep.
Daily:
-Inverse H&S pattern.
-Bullish M pattern.
4H:
-Inverse H&S pattern.
-IC.

Potential Buy Opportunity on AUDNZDReasons I think this pair will rise:
- Confirmed trend line printed a higher low.
- Bullish RSI divergence on Daily
- RSI was oversold on Daily chart
Thoughts?

AUDNZD short term LONG idea in M30AUDNZD short term BUY idea. AUDNZD is in reversal in Daily and H4 timeframes.
Possible setup for AUDNZD to turn long in M30 TF.
Please note the historical charts shows this pair has lot of liquidity sweeps and manipulation. Please trade with proper risk management.
This is for educational purpose only. Not a financial or investment advise.

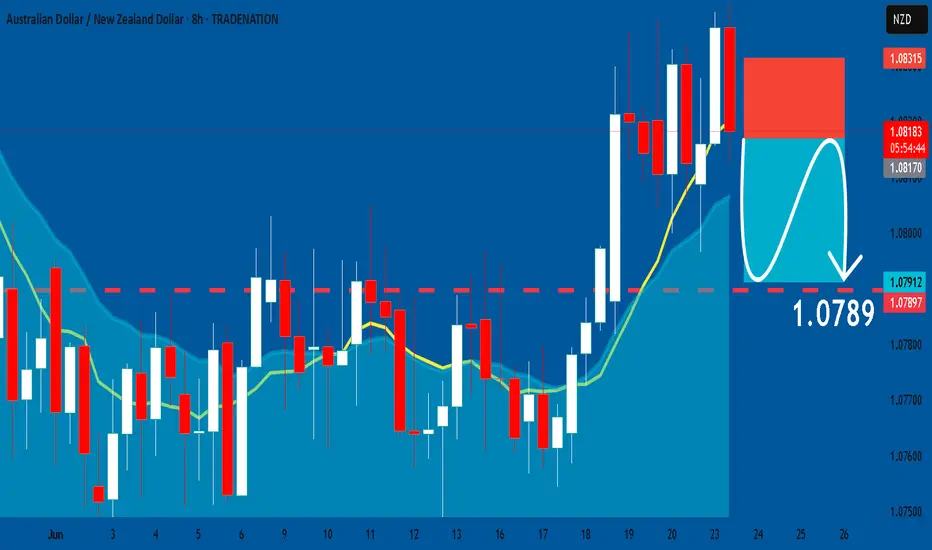
AUD_NZD LOCAL LONG|
✅AUD_NZD is trading along the rising support line
And as the pair is going up now
After the retest of the line
I am expecting the price to keep growing
To retest the supply levels above at 1.0789
LONG🚀
✅Like and subscribe to never miss a new idea!✅
Disclosure: I am part of Trade Nation's Influencer program and receive a monthly fee for using their TradingView charts in my analysis.

AUDNZD we expect it to gradually move up.AUDNZD currency pair is at a strong resistance level and trade line so we expect it to gradually move up.

AUDNZD The Target Is DOWN! SELL!
My dear followers,
I analysed this chart on AUDNZD and concluded the following:
The market is trading on 1.0803 pivot level.
Bias - Bearish
Technical Indicators: Both Super Trend & Pivot HL indicate a highly probable Bearish continuation.
Target - 1.0792
About Used Indicators:
A super-trend indicator is plotted on either above or below the closing price to signal a buy or sell. The indicator changes color, based on whether or not you should be buying. If the super-trend indicator moves below the closing price, the indicator turns green, and it signals an entry point or points to buy.
Disclosure: I am part of Trade Nation's Influencer program and receive a monthly fee for using their TradingView charts in my analysis.
———————————
WISH YOU ALL LUCK

AUDNZD On The Rise! BUY!
My dear followers,
This is my opinion on the AUDNZD next move:
The asset is approaching an important pivot point 1.0782
Bias - Bullish
Technical Indicators: Supper Trend generates a clear long signal while Pivot Point HL is currently determining the overall Bullish trend of the market.
Goal - 1.0797
About Used Indicators:
For more efficient signals, super-trend is used in combination with other indicators like Pivot Points.
Disclosure: I am part of Trade Nation's Influencer program and receive a monthly fee for using their TradingView charts in my analysis.
———————————
WISH YOU ALL LUCK

AUDNZD - Bullish Double BottomHello Traders !
On Wednesday 25 june, The AUDNZD reached the support level (1.07702 - 1.07584).
The price formed a double bottom pattern.
Currently, the neckline is broken !
So, I expect a bullish move🚀
______________
TARGET: 1.08260

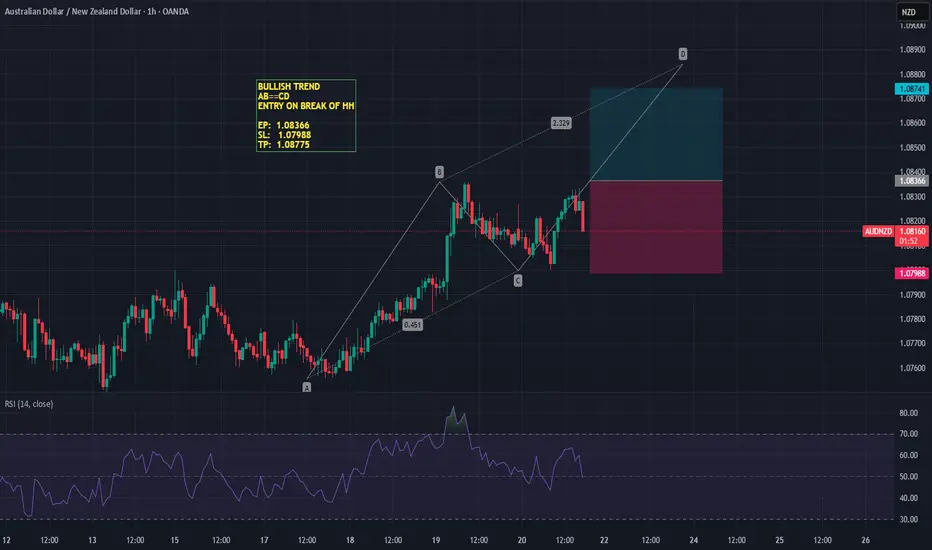
Long AN Entered a long position on AUD/NZD based on strong higher time frame confluence. Price action has shown clear bullish structure with higher highs and higher lows forming on the 8-hour chart, backed by confirmation on the daily timeframe.
AUD-NZD Long From Rising Support! Buy!
Hello,Traders!
AUD-NZD went down but
Will soon retest a rising
Support line from where
We will be expecting a
Bullish rebound and a move up
Buy!
Comment and subscribe to help us grow!
Check out other forecasts below too!
Disclosure: I am part of Trade Nation's Influencer program and receive a monthly fee for using their TradingView charts in my analysis.

AUDNZD | Comp. Trade 03AUDNZD is in bearish trend and forming a descending channel with no bullish divergence.It is an ample indication that it will continue its bearish trend.

Bearish look out for AUDNZDPrice is pulling back to an area of interest where the
Fib level 50% - 61.8% stands,
previous support,
50 ema

EUR/AUD Short, EUR/NZD Short, NZD/USD Long and AUD/NZD ShortEUR/AUD Short
Minimum entry requirements:
- If tight non-structured 1H continuation forms, 15 min risk entry within it if the continuation is structured on the 15 min chart or reduced risk entry on the break of it.
- If tight structured 1H continuation forms, 1H risk entry within it or reduced risk entry on the break of it.
EUR/NZD Short
Minimum entry requirements:
- If tight non-structured 1H continuation forms, 15 min risk entry within it if the continuation is structured on the 15 min chart or reduced risk entry on the break of it.
- If tight structured 1H continuation forms, 1H risk entry within it or reduced risk entry on the break of it.
NZD/USD Long
Minimum entry requirements:
- If tight non-structured 1H continuation forms, 15 min risk entry within it if the continuation is structured on the 15 min chart.
- If tight structured 1H continuation forms, 1H risk entry within it.
AUD/NZD Short
Minimum entry requirements:
- If tight non-structured 1H continuation forms, 15 min risk entry within it if the continuation is structured on the 15 min chart.
- If tight structured 1H continuation forms, 1H risk entry within it.

BUY AUDNZDAUDNZD should see a price increase from this newly found and retested support. Buy here at 1,0808 and take profit at 1,085. Inverted head and shoulder used as entry model.

AUD_NZD LOCAL LONG|
✅AUD_NZD has retested a key support level of 1.0800
And as the pair is already making a bullish rebound
A move up to retest the supply level above at 1.0820 is likely
LONG🚀
✅Like and subscribe to never miss a new idea!✅
Disclosure: I am part of Trade Nation's Influencer program and receive a monthly fee for using their TradingView charts in my analysis.

AUDNZD: Short Trading Opportunity
AUDNZD
- Classic bearish formation
- Our team expects pullback
SUGGESTED TRADE:
Swing Trade
Short AUDNZD
Entry - 1.0817
Sl - 1.0831
Tp - 1.0789
Our Risk - 1%
Start protection of your profits from lower levels
Disclosure: I am part of Trade Nation's Influencer program and receive a monthly fee for using their TradingView charts in my analysis.
❤️ Please, support our work with like & comment! ❤️
AUDNZD TRADING RECAPJoin me for a detailed recap of the AUDNZD trading session! Discover the key price movements, pivotal areas, and our strategic insights on this currency pair. Whether you’re looking to refine your trading strategy or seeking inspiration for your next move, this recap covers essential takeaways that can enhance your trading approach. Don't miss out—tune in to stay ahead of the market trends and make informed decisions in your trading journey!

AUDNZD BULLISH SETUPThe 4-hour chart of AUD/NZD shows a strong bullish breakout from a prolonged consolidation phase, followed by a healthy retest of the breakout level, suggesting the pair is gearing up for further upside.
Key Observations:
Consolidation Breakout: After spending several weeks in a tight consolidation range between 1.0760–1.0800, the price has convincingly broken above the range resistance near 1.0810.
Key Level Retest: The breakout zone (previous resistance) is now acting as new support, confirmed by multiple rejections (highlighted area).
Bullish Momentum: Structure is forming higher highs and higher lows, indicating continuation of upward trend.
Upside Target: With the breakout holding, the next logical target lies near the resistance zone around 1.0910, which served as a previous swing high.
Conclusion:
AUD/NZD is showing bullish strength after breaking out of consolidation and holding above the retested key level. As long as 1.0800–1.0810 support holds, the pair remains poised for a bullish continuation toward the 1.0900–1.0920 resistance zone. A break below this level would invalidate the setup and bring price back into the previous range.

Buy AUDNZDaudnzd as been netrual compared to the marke, a very low beta. But there are more risk on the set up.
