NZDAUD trade ideas

AUDNZD | XABCD PatternAUDNZD is clearly printing XABCD pattern which indicates bullish reversal from PRZ.We may take short trade after its breaking point B with SL at point C.After reversal we may againg ride a bullish trend after its breaking of first HH.

AUDNZD: Bulls Will Push
It is essential that we apply multitimeframe technical analysis and there is no better example of why that is the case than the current AUDNZD chart which, if analyzed properly, clearly points in the upward direction.
Disclosure: I am part of Trade Nation's Influencer program and receive a monthly fee for using their TradingView charts in my analysis.
❤️ Please, support our work with like & comment! ❤️

NNFX AUDNZD Short - Full Signal DelayedSignal: AUDNZD Short — Full Signal Delayed
Context: C1 signal, C2 2 days ago
Probability: Normal
Risk: 0.5% → C2 signal 2 days ago, all other indicators align. Volume is short.
R:R Plan: 1.3R, 75% scale-out at 1xATR TP for lower probability & drawdown management.
---
Notes:
Again, this is a trade I would not normally take, however, market gapped considerably below the close of the candle which my C1 triggered. The original candle where my C1 should have triggered if this was to be a full signal on time, was literally 1-2 pips away from triggering. Price had then pulled back on the next day, then gone short again on this day, triggering the C1.
Due to an order block sitting about 15 pips below price, I also would have used a pending order to enter the market which would not have been triggered until today.
Given this circumstance, and the gift of hindsight, this would have been a missed signal if I did not enter. I managed to enter at the same price I would have if the trade was completed 2 days ago but reduced risk to 0.5% to be cautious.

AUDNZD short movePrice is rising towards our supply zone, any bearish reaction can lead fall in price.

AUDNZD: Long Trade Explained
AUDNZD
- Classic bullish formation
- Our team expects growth
SUGGESTED TRADE:
Swing Trade
Buy AUDNZD
Entry Level - 1.0766
Sl - 1.0740
Tp - 1.0812
Our Risk - 1%
Start protection of your profits from lower levels
Disclosure: I am part of Trade Nation's Influencer program and receive a monthly fee for using their TradingView charts in my analysis.
❤️ Please, support our work with like & comment! ❤️

AUD/NZD SENDS CLEAR BULLISH SIGNALS|LONG
Hello, Friends!
AUD/NZD pair is trading in a local downtrend which we know by looking at the previous 1W candle which is red. On the 1D timeframe the pair is going down too. The pair is oversold because the price is close to the lower band of the BB indicator. So we are looking to buy the pair with the lower BB line acting as support. The next target is 1.089 area.
Disclosure: I am part of Trade Nation's Influencer program and receive a monthly fee for using their TradingView charts in my analysis.
✅LIKE AND COMMENT MY IDEAS✅

AUDNZD: Long Signal with Entry/SL/TP
AUDNZD
- Classic bullish formation
- Our team expects pullback
SUGGESTED TRADE:
Swing Trade
Long AUDNZD
Entry - 1.0769
Sl - 1.0744
Tp - 1.0819
Our Risk - 1%
Start protection of your profits from lower levels
Disclosure: I am part of Trade Nation's Influencer program and receive a monthly fee for using their TradingView charts in my analysis.
❤️ Please, support our work with like & comment! ❤️

AUD_NZD BEARISH BREAKOUT|SHORT|
✅AUD_NZD made a bearish
Breakout of the key horizontal
Level of 1.0783 and the breakout
Is confirmed so we are locally
Bearish biased and we will be
Expecting a further bearish
Move down
SHORT🔥
✅Like and subscribe to never miss a new idea!✅
Disclosure: I am part of Trade Nation's Influencer program and receive a monthly fee for using their TradingView charts in my analysis.

AUDNZD buy setupHi traders. My view on this one, price is approaching a weekly demand zone which aligns with a strong support level.
Please let me know what you think.

AUD/NZD – Bearish Trade Setup-wk6The pair is forming a descending channel, which typically signals bearish continuation. Based on the current price action and technical structure, we are executing a short trade setup with the following stats:
🔹 Pair: AUD/NZD T/F:1H
🔹 Trend: Bearish (Descending Channel)
🔹 Entry Point (Sell Stop): 1.07593
🔹 Stop Loss (SL): 1.08542
🔹 Take Profit 1 (TP1): 1.06644
🔹 Take Profit 2 (TP2): 1.05695
🔹 Lot Size: 0.18
🔹 Risk:Reward Ratios:
▫️ Trade 1: 1:1 (Risk $100 : Reward $100)
▫️ Trade 2: 1:2 (Risk $100 : Reward $200)
🔹 Total Risk: $200
🔹 Potential Reward: $300
📉 We're capitalizing on momentum within the descending channel and looking for breakdown confirmation to hit our targets.
#AUDNZD #ForexTrading #DescendingChannel #BearishSetup #PriceAction #ForexSignals #RiskReward #TradingPlan #TechnicalAnalysis #ShortTrade #FXMarket #ForexCommunity #TradingView #MarketOutlook

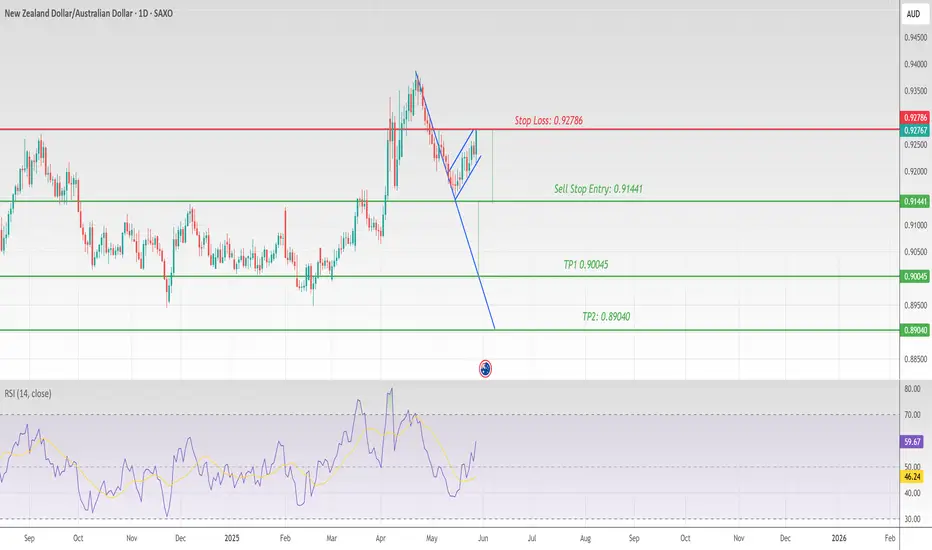
NZDAUD 1 Daily Chart Bearish Flag Continuation PatternNZDAUD 1 Daily Chart Bearish Flag Continuation Pattern
Stop Loss: 0.92786
Sell Stop Entry: 0.91441
TP1 0.90045
TP2: 0.89040
No Divergence
AUD/NZD For Bearishwait for pull-back near by entry point and then go short
general trend is down trend
have fun :)
AUD/NZD - Strong Bullish Trade Setup🔥 AUD/NZD 8H Bullish Setup – Demand Zone + Liquidity Grab
📍 Current Structure:
Price is pulling back into a refined demand zone, perfectly aligned with the 71% Fibonacci retracement.
This zone also holds trendline support from the higher timeframe — strong structural confluence.
Price is forming a corrective wave, likely completing a classic ABC pattern down into demand.
📊 Volume Insight:
A volume spike at the lows hints at aggressive buying — likely institutional.
Smart money may be accumulating just before a bullish push.
📈 Play Idea:
Looking for price to react inside the 71% zone, potentially forming a bullish engulfing or BOS (break of structure).
Clear target is Buy Side Liquidity (BSL) above recent highs — that's where stops are clustered.
🧠 Confluences:
Demand Zone ✅
71% Fib Level ✅
Trendline Support ✅
Volume Spike ✅
Buy Side Liquidity Target ✅
🎯 Bias: Strongly Bullish
Waiting for a clean trigger — bullish candle confirmation or BOS.
This setup screams smart money accumulation.

AUDNZD-H1-SHORTThe price, previously supported by ascending trendlines, has recently broken below these lines, signaling a potential reversal in momentum. The Ichimoku cloud (Kumo) highlights critical support and resistance zones, with the price moving outside the cloud, reinforcing the breakdown of the prior uptrend. The Tenkan-sen and Kijun-sen lines confirm this shift through their crossover, aligning with the wave structure and indicating a bearish turn. This setup suggests an opportunity for a short position, as the market may be entering a consolidation or downtrend phase.
If you liked this analysis, hit the BOOST !


So Gold Dropped, Anyone caught this So gold fell to low key point.
From the fundamental perspectives, anything strengthening the dollar?
Share information

AUDNZD: Long Trading Opportunity
AUDNZD
- Classic bullish setup
- Our team expects bullish continuation
SUGGESTED TRADE:
Swing Trade
Long AUDNZD
Entry Point - 1.0821
Stop Loss - 1.0797
Take Profit - 1.0866
Our Risk - 1%
Start protection of your profits from lower levels
Disclosure: I am part of Trade Nation's Influencer program and receive a monthly fee for using their TradingView charts in my analysis.
❤️ Please, support our work with like & comment! ❤️

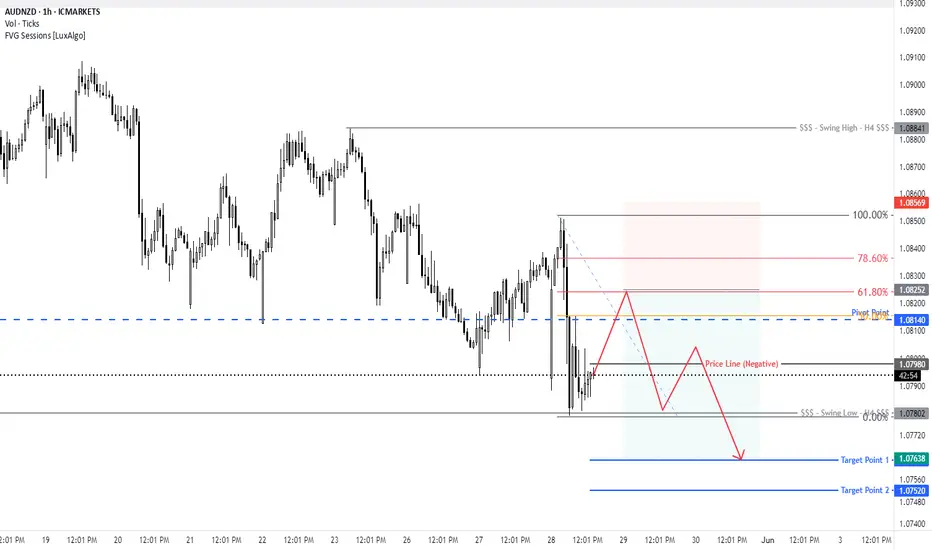
Falling towards 61.8% Fibonacci support?AUD/NZD is falling towards the pivot and could bounce to the 1st resistance.
Pivot: 1.0750
1st Support: 1.07095
1st Resistance: 1.08521
Risk Warning:
Trading Forex and CFDs carries a high level of risk to your capital and you should only trade with money you can afford to lose. Trading Forex and CFDs may not be suitable for all investors, so please ensure that you fully understand the risks involved and seek independent advice if necessary.
Disclaimer:
The above opinions given constitute general market commentary, and do not constitute the opinion or advice of IC Markets or any form of personal or investment advice.
Any opinions, news, research, analyses, prices, other information, or links to third-party sites contained on this website are provided on an "as-is" basis, are intended only to be informative, is not an advice nor a recommendation, nor research, or a record of our trading prices, or an offer of, or solicitation for a transaction in any financial instrument and thus should not be treated as such. The information provided does not involve any specific investment objectives, financial situation and needs of any specific person who may receive it. Please be aware, that past performance is not a reliable indicator of future performance and/or results. Past Performance or Forward-looking scenarios based upon the reasonable beliefs of the third-party provider are not a guarantee of future performance. Actual results may differ materially from those anticipated in forward-looking or past performance statements. IC Markets makes no representation or warranty and assumes no liability as to the accuracy or completeness of the information provided, nor any loss arising from any investment based on a recommendation, forecast or any information supplied by any third-party.

AUD_NZD SUPPORT AHEAD|LONG|
✅AUD_NZD is going down now
But a strong support level is ahead at 1.0780
Thus I am expecting a rebound
And a move up towards the target at 1.0827
LONG🚀
✅Like and subscribe to never miss a new idea!✅
Disclosure: I am part of Trade Nation's Influencer program and receive a monthly fee for using their TradingView charts in my analysis.

AUDNZD (SUPPLY+BOS+OTE)Hello traders!
We have supply + OTE.
Now we can expect reversal on LTF from 705 fib level + 0.5 Supply zone.
Have a profitable day and don't forget to subscribe for more updates!
If you like this idea drop a like, leave a comment.

AUDNZD both scenarios possibles
OANDA:AUDNZD first analysis till target (attached), here is update and new view on AUDNZD.
We having trend line which is breaked, we having and H&S on top of trend, which also is breaked, price is after make bearish push, but in last period is stop progressing, its make few bouncens on sup zone 1.08230.
In case we see strong bearish push - break of 1.08350 we will have high chance to see higher bearish trend, in case we having break of top sup zone 1.09100 (violet line) we will having bullish confirm.
Personal more bullish, but lets wait for confirms.
Targets:
BULL: 1.10200, 1.10500
BEAR: 1.07800, 1.07500

