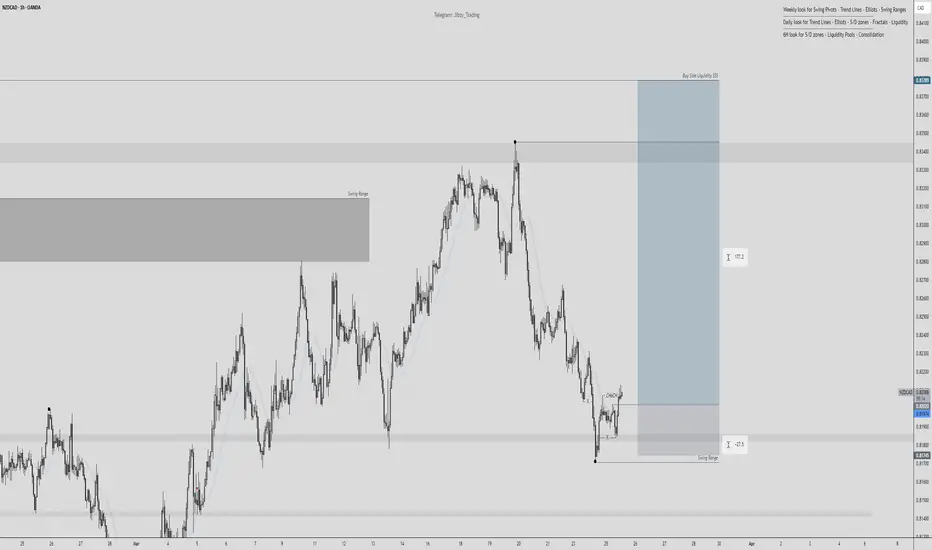
NZD/CAD - Long Trade IdeaCurrently have been watching this market for a few weeks now and we have been slow progressing into this level.
Smaller Time frames have just displayed our change of character indicating that we will be starting to see a little more volume come in for buyers. After already taking out the previous high I will be looking for entries soon looking to sweep Buy side Liquidity
Price has already swept Sell Side Liquidity so now we will let time now just make its move'
Good luck to any traders that might follow
NZDCAD trade ideas
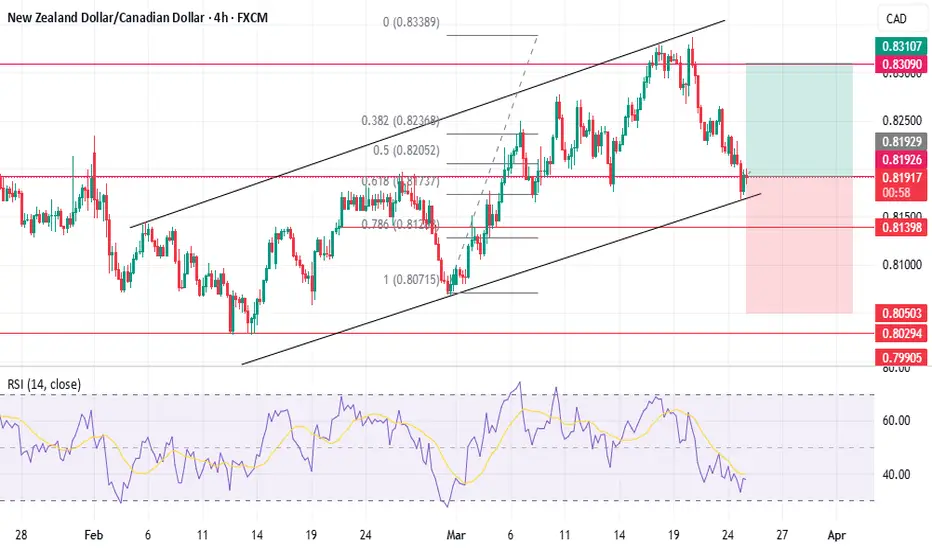
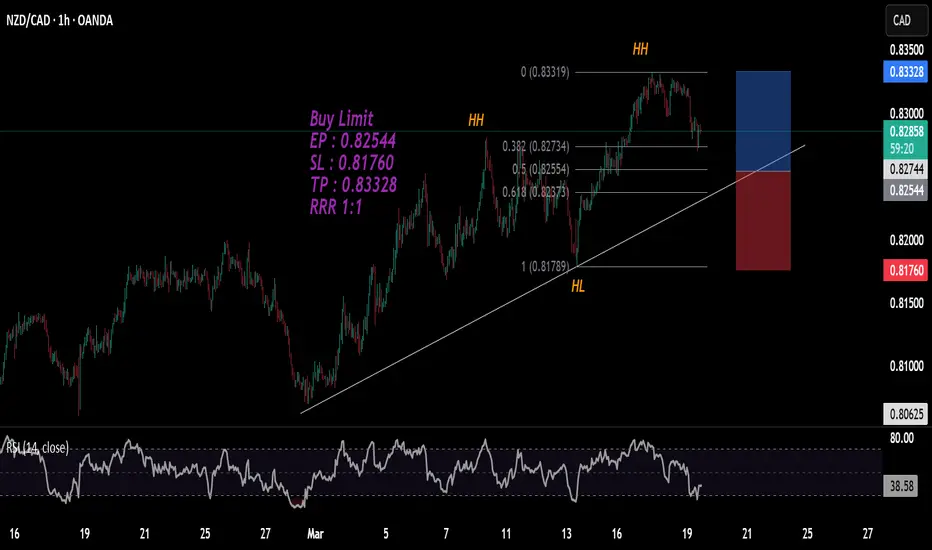
NZDCADWe can attempt to buy NZDCAD from specified level as it make HL , also there is no bearish divergence occur indicate that it moves upward.
SL , TP mention in chart.

NZDCAD ShortNZDCAD is now net short on the regression break.
I am consider this pair and the EA that best suits the trading considerations.

NZD-CAD Risky Long! Buy!
Hello,Traders!
NZD-CAD made a retest
Of the horizontal support
Of 0.8170 and we are already
Seeing a bullish rebound
So we are bullish biased
And we will be expecting
A further bullish move up
Buy!
Comment and subscribe to help us grow!
Check out other forecasts below too!
Disclosure: I am part of Trade Nation's Influencer program and receive a monthly fee for using their TradingView charts in my analysis.

NZDCAD Reached the support and may pullback from here.NZDCAD has reached the support and many times is rebound form here and I believe that it will move up again as seen form the graph.

NZD/CAD For Bearishyou can go short now
general trend is up trend
current phase is pull-back
have fun :)

NZD/CAD "Kiwi vs Loonie" Forex Market Heist Plan🌟Hi! Hola! Ola! Bonjour! Hallo! Marhaba!🌟
Dear Money Makers & Thieves, 🤑💰💸✈️
Based on 🔥Thief Trading style technical and fundamental analysis🔥, here is our master plan to heist the NZD/CAD "Kiwi vs Loonie" Forex market. Please adhere to the strategy I've outlined in the chart, which emphasizes long entry. Our aim is the high-risk Red Zone. Risky level, overbought market, consolidation, trend reversal, trap at the level where traders and bearish robbers are stronger. 🏆💸Book Profits wealthy and safe trade.💪🏆🎉
Entry 📈 : "The heist is on! Wait for the MA breakout (0.82800) then make your move - Bullish profits await!"
however I advise to Place Buy stop orders above the Moving average (or) Place buy limit orders within a 15 or 30 minute timeframe most recent or swing, low or high level.
📌I strongly advise you to set an alert on your chart so you can see when the breakout entry occurs.
Stop Loss 🛑:
Thief SL placed at the recent/swing low or high level Using the 4H timeframe (0.81800) swing trade basis.
SL is based on your risk of the trade, lot size and how many multiple orders you have to take.
Target 🎯: 0.83700 (or) Escape Before the Target
🧲Scalpers, take note 👀 : only scalp on the Long side. If you have a lot of money, you can go straight away; if not, you can join swing traders and carry out the robbery plan. Use trailing SL to safeguard your money 💰.
NZD/CAD "Kiwi vs Loonie" Forex Market is currently experiencing a Bullish trend., driven by several key factors. 📰🗞️Get & Read the Fundamental, Macro Economics, COT Report, Quantitative Analysis, Intermarket Analysis, Sentimental Outlook, Future Trend Move:
Before start the heist plan read it.👉👉👉
📌Keep in mind that these factors can change rapidly, and it's essential to stay up-to-date with market developments and adjust your analysis accordingly.
⚠️Trading Alert : News Releases and Position Management 📰 🗞️ 🚫🚏
As a reminder, news releases can have a significant impact on market prices and volatility. To minimize potential losses and protect your running positions,
we recommend the following:
Avoid taking new trades during news releases
Use trailing stop-loss orders to protect your running positions and lock in profits
💖Supporting our robbery plan 💥Hit the Boost Button💥 will enable us to effortlessly make and steal money 💰💵. Boost the strength of our robbery team. Every day in this market make money with ease by using the Thief Trading Style.🏆💪🤝❤️🎉🚀
I'll see you soon with another heist plan, so stay tuned 🤑🐱👤🤗🤩

NZDCAD BUY PROJECTION Market is in a weekly descending triangle pattern creating a current daily bullish market environment, with the continuous higher highs and higher lows created.
I'm anticipating a bounce on the current support area.

idea on a trendWe have a great bearish flag breaking out great trend.USD can return back to the low/mid-1.42s
"BoC Governor Macklem’s remarks on tariffs and monetary policy yesterday underscored the Bank’s sensitivity to the inflationary consequences of trade wars. He noted that the hot February CPI report had got policymakers’ attention but their outlook had not fundamentally changed. Market expectations for policy moves were unchanged around the comments. Swaps reflect around 80% probability of a 25bps cut by June."
"The USD’s failed push higher yesterday should put an effective cap on funds in the short run at least. Price action indicates a clear rejection of yesterday’s test of 1.44 and the USD closed the session back under resistance around 1.4340/50. This may set the market up for another push on trend support at 1.4300/10, with a break below here likely to drive the USD back to the low/mid-1.42s"

NZD/CAD For Bullishyou can go long now
or
wait for pull-back near by entry point and then go long
general trend is up trend
have fun :)

Bearish drop?NZD/CAD is rising towards the pivot and could drop to the 1st support.
Pivot: 0.82703
1st Support: 0.81897
1st Resistance: 0.83299
Risk Warning:
Trading Forex and CFDs carries a high level of risk to your capital and you should only trade with money you can afford to lose. Trading Forex and CFDs may not be suitable for all investors, so please ensure that you fully understand the risks involved and seek independent advice if necessary.
Disclaimer:
The above opinions given constitute general market commentary, and do not constitute the opinion or advice of IC Markets or any form of personal or investment advice.
Any opinions, news, research, analyses, prices, other information, or links to third-party sites contained on this website are provided on an "as-is" basis, are intended only to be informative, is not an advice nor a recommendation, nor research, or a record of our trading prices, or an offer of, or solicitation for a transaction in any financial instrument and thus should not be treated as such. The information provided does not involve any specific investment objectives, financial situation and needs of any specific person who may receive it. Please be aware, that past performance is not a reliable indicator of future performance and/or results. Past Performance or Forward-looking scenarios based upon the reasonable beliefs of the third-party provider are not a guarantee of future performance. Actual results may differ materially from those anticipated in forward-looking or past performance statements. IC Markets makes no representation or warranty and assumes no liability as to the accuracy or completeness of the information provided, nor any loss arising from any investment based on a recommendation, forecast or any information supplied by any third-party.

NZDCAD breakdown or support ?NZDCAD is trading in a ascending channel and now reached the higher low support area will it take support or will breakdown, trade accordingly

NZDCAD Broke the SupportNZDCAD Broke the Support zone and retouched signaling further bearish movement. Looking at a potential SELL

@NzdcadAs we can see on de daily and weekly we have the market on a bullish trend, we were expecting the market to retrace back to the zone and we have it on de zone so we are waiting for entry on de 1h and 30min to enter the trade

NZDCAD is in a very nice condition to buyNZDCAD is in a very nice condition to buy , time to buy
continue to market structure


NZDCAD: Bearish After the News?! 🇳🇿🇨🇦
NZDCAD turned bearish after a release of Canadian Inflation data.
The price retraced from a key daily resistance and broke
a support line of a rising parallel channel on an hourly time frame.
The market may drop at least to 0.8293
❤️Please, support my work with like, thank you!❤️
I am part of Trade Nation's Influencer program and receive a monthly fee for using their TradingView charts in my analysis.

NZD/CAD - Day Trading Analysis With Volume ProfileOn NZD/CAD , it's nice to see a strong buying reaction at the price of 0.81930.
There's a significant accumulation of contracts in this area, indicating strong buyer interest. I believe that buyers who entered at this level will defend their long positions. If the price returns to this area, strong buyers will likely push the market up again.
Strong rejection of lower prices + Uptrend and high volume cluster are the main reasons for my decision to go long on this trade.
Happy trading
Dale

NZDCADAll timeframes in sync, looking for price to come back to the zone to then possibly have more confluences in line to then take a buy position

NZDCAD Buy ForecastNZDCAD New Forecast👨💻👨💻
Am expecting a bullish movement to 1.2+RR
This is my personal trade and not in anyway a mandatory setup.
Note:
Follow proper risk management rules. Never risk more then 2% of your total capital. Money management is the key of success in this business...... Set your own SL & TP.
Please support this idea with a Like and COMMENT if you find it useful click "follow" on our profile if you will like these type of trading ideas delivered straight to your email in the future.
Thanks for your continued support!! lemme know your thoughts in the comment sec..

NZDCADBounced off latest daily support last week. Now have a minor H1 resistance, once broken and retest is made with bullish momentum, possible movement to the upside.
