SELLGod First
Minimum Risk Maximum Reward
Action Backed Believe
# faith, strategy, and execution all in one #
NZDCAD trade ideas

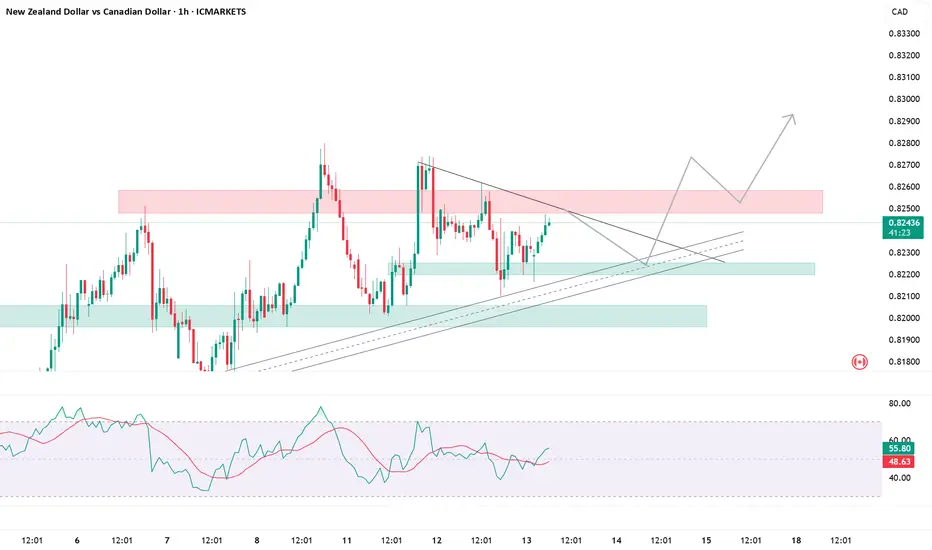
NZDCAD: Strong Bullish Signals 🇳🇿🇨🇦
I see 2 strong price action confirmations on NZDCAD:
the price broke a resistance line of a bullish flag
and then formed a confirmed change of character CHoCH on a 4H.
I think that the market will continue a bullish rally.
Next resistance - 0.83
❤️Please, support my work with like, thank you!❤️
I am part of Trade Nation's Influencer program and receive a monthly fee for using their TradingView charts in my analysis.

NZDCAD NICE SHORT OPPORTUNITY its an amazing opportunity for short nzdcad with a nice R/R
i beleive we will hit the target


NZDCAD PRINTING REVERSALTechnically:
NZDCAD printing double top
NZDCAD printing bearish divergence
NZDCAD supporting bearish trendline

NZDCAD may take some time to breakoutNZDCAD may take some time to breakout. But will remain Bullish.
Update on Buys NCADthis is an update I sent 3 trades EU of which stop loss of 20 pips and GU of which it hit take profits of 40 pips NCAD sell limit is active with 15 pips profits we are up 1% for the day and 3% for the week.


NZDCAD Swing Long PositionEntry: 0.81306
Stop Loss: 0.80188
Take Profit 1: 0.82542
Take Profit 2: 0.83529
Take Profit 3: 0.84448

NZDCAD BUY OPPORTUNITY Price is set to trade bullish as we had a recent bounce off fur trend line. A buy opportunity is envisaged from the current market price. Price maintains a bullish momentum


NZDCAD FORECAST This is the pair I'm watching closely today! In the higher timeframe, the price signals that more selling potential is about to come. I love the sequence in the lower timeframe. What I'm waiting for is to see if the price will develop a 1-2-3 structure, then look for a rejection candle as my confirmation for the risk entry.

NZDCAD-BULLISH SETUPNZDCAD seems to be in bull run as it is continue to print new HH and HL with respecting the trendline.

Bullish bounce off overlap support?NZD/CAD is falling towards the pivot and could bounce to the 1st resistance.
Pivot: 0.81661
1st Support: 0.81118
1st Resistance: 0.82660
Risk Warning:
Trading Forex and CFDs carries a high level of risk to your capital and you should only trade with money you can afford to lose. Trading Forex and CFDs may not be suitable for all investors, so please ensure that you fully understand the risks involved and seek independent advice if necessary.
Disclaimer:
The above opinions given constitute general market commentary, and do not constitute the opinion or advice of IC Markets or any form of personal or investment advice.
Any opinions, news, research, analyses, prices, other information, or links to third-party sites contained on this website are provided on an "as-is" basis, are intended only to be informative, is not an advice nor a recommendation, nor research, or a record of our trading prices, or an offer of, or solicitation for a transaction in any financial instrument and thus should not be treated as such. The information provided does not involve any specific investment objectives, financial situation and needs of any specific person who may receive it. Please be aware, that past performance is not a reliable indicator of future performance and/or results. Past Performance or Forward-looking scenarios based upon the reasonable beliefs of the third-party provider are not a guarantee of future performance. Actual results may differ materially from those anticipated in forward-looking or past performance statements. IC Markets makes no representation or warranty and assumes no liability as to the accuracy or completeness of the information provided, nor any loss arising from any investment based on a recommendation, forecast or any information supplied by any third-party.


Potential bearish drop?NZD/CAD has reacted off the resistance level which lines up with the 127.2% Fibonacci extension and could drop from this level to our take profit.
Entry: 0.82762
Why we like it:
There is a resistance level at the 127.2% Fibonacci extension.
Stop loss: 0.83048
Why we like it:
There is a resistance level that aligns with the 161.8% Fibonacci extension.
Take profit: 0.81723
Why we like it:
There is an overlap support level that lines up with the 509% Fibonacci retracement.
Enjoying your TradingView experience? Review us!
Please be advised that the information presented on TradingView is provided to Vantage (‘Vantage Global Limited’, ‘we’) by a third-party provider (‘Everest Fortune Group’). Please be reminded that you are solely responsible for the trading decisions on your account. There is a very high degree of risk involved in trading. Any information and/or content is intended entirely for research, educational and informational purposes only and does not constitute investment or consultation advice or investment strategy. The information is not tailored to the investment needs of any specific person and therefore does not involve a consideration of any of the investment objectives, financial situation or needs of any viewer that may receive it. Kindly also note that past performance is not a reliable indicator of future results. Actual results may differ materially from those anticipated in forward-looking or past performance statements. We assume no liability as to the accuracy or completeness of any of the information and/or content provided herein and the Company cannot be held responsible for any omission, mistake nor for any loss or damage including without limitation to any loss of profit which may arise from reliance on any information supplied by Everest Fortune Group.

NZD/CAD Triangle BreakoutThe NZD/CAD pair on the M30 timeframe presents a Potential Buying Opportunity due to a recent Formation of a Triangle Pattern. This suggests a shift in momentum towards the upside and a higher likelihood of further advances in the coming hours.
Possible Long Trade:
Entry: Consider Entering A Long Position around Trendline Of The Pattern.
Target Levels:
1st Resistance – 0.8268
2nd Resistance – 0.8301
🎁 Please hit the like button and
🎁 Leave a comment to support for My Post !
Your likes and comments are incredibly motivating and will encourage me to share more analysis with you.
Best Regards, KABHI_TA_TRADING
Thank you.

S&R buy Limit the market took the liquidity changed market structure we look to retest the broken high therefore S&R is formed

NZDCAD BUY The MACD is below its signal line and positiveNZDCAD The price could retrace, the RSI is above its neutrality area at 50. The MACD is below its signal line and positive. Moreover the price jumped from the 8EMA.

NZD_CAD POTENTIAL LONG|
✅NZD_CAD is trading in a
Local uptrend and the made
A bullish breakout of the falling
Resistance line which is now
A support and the pair made a
Retest of the line and is already
Making a bullish rebound
So we will be expecting a
Further bullish move up
LONG🚀
✅Like and subscribe to never miss a new idea!✅

NZDCAD AT PULLBACK SUPPORT LEVEL!Price just tested the pullback support level. I expect price to trade bullish away from the current market price. A buy opportunity is envisaged. We just had a bullish reversal pattern formed

POTENTIAL LONG TRADE SET UP FOR NZDCADAnalysis: Utilizing chart patterns, highs & lows, and impulses & corrections, the focus is on identifying a continuation corrective structure following a breakout.
The price has approached a previous swing low zone on the higher time frame (HTF) while moving within a descending broadening wedge. On the Mid time frame (MTF), we have a bearish impulse and bullish reversal structure. We will now monitor for a continuation structure to identify a potential entry point for the trade.
Expectation: A upward move is expected, with the target set at the top of the descending broadening structure.
⚠️ Reminder: Always conduct your own analysis and apply proper risk management, as forex trading involves no guarantees. This is a high-risk activity, and past performance is not indicative of future results. Trade responsibly!

