NZDCADThe NZDCAD pair is near a demand zone on the 15-minute chart, signaling a potential buy opportunity. Look for bullish candlestick patterns to confirm entry.
NZDCAD trade ideas

NZD_JPY LOCAL BULLISH BIAS|LONG|
✅NZD_JPY has retested a key support level of 0.8135
And as the pair is already making a bullish rebound
A move up to retest the supply level above at 0.8162 is likely
LONG🚀
✅Like and subscribe to never miss a new idea!✅

NZD/CAD WILL GO FOR BULLISHI expect the market to break the 0.81362 resistance level and move higher. This rise has the potential to go up to 0.83662.


Simple supply and demandPrice broke structure to the downside, created imbalance, pulled back and took the money of early impatient sellers. It has tapped us in and we're moving with it to the downside

NZDCAD Potential DownsidesHey Traders, in today's trading session we are monitoring NZDCAD for a selling opportunity around 0.82400 zone, NZDCAD is trading in a downtrend and currently is in a correction phase in which it is approaching the trend at 0.82400 support and resistance area.
Trade safe, Joe.

SellWe are from support going to resistant what we have to do js to sell at that resistant... Remember it is qml

NZD/CAD 4HNZD/CAD 4H
Price is showing clear bullish momentum followed with early buyer liquidity.
Once price sweeps early buyer liquidity and fills the imbalance i will be looking to enter a buy positions targeting multiple areas of liquidity with my final target being set at 0.84330

NZDCADWe expect the pair to rebound from the Order Block after taking liquidity and target the last high.
Bearish drop?NZD/CAD is rising towards the pivot and could reverse to the 1st support.
Pivot: 0.81842
1st Support: 0.81045
1st Resistance: 0.82431
Risk Warning:
Trading Forex and CFDs carries a high level of risk to your capital and you should only trade with money you can afford to lose. Trading Forex and CFDs may not be suitable for all investors, so please ensure that you fully understand the risks involved and seek independent advice if necessary.
Disclaimer:
The above opinions given constitute general market commentary, and do not constitute the opinion or advice of IC Markets or any form of personal or investment advice.
Any opinions, news, research, analyses, prices, other information, or links to third-party sites contained on this website are provided on an "as-is" basis, are intended only to be informative, is not an advice nor a recommendation, nor research, or a record of our trading prices, or an offer of, or solicitation for a transaction in any financial instrument and thus should not be treated as such. The information provided does not involve any specific investment objectives, financial situation and needs of any specific person who may receive it. Please be aware, that past performance is not a reliable indicator of future performance and/or results. Past Performance or Forward-looking scenarios based upon the reasonable beliefs of the third-party provider are not a guarantee of future performance. Actual results may differ materially from those anticipated in forward-looking or past performance statements. IC Markets makes no representation or warranty and assumes no liability as to the accuracy or completeness of the information provided, nor any loss arising from any investment based on a recommendation, forecast or any information supplied by any third-party.

nzdcad sell tradeThe Relative Strength Index (RSI) is showing a downward trend, indicating weakening momentum. Additionally, the Moving Average Convergence Divergence (MACD) is showing a bearish crossover, further supporting the potential for a downward move

Bullish bounce off 50% Fibonacci support?NZD/CAD is falling towards the support level which is an overlap support that aligns with the 50% Fibonacci retracement and could bounce from this level to our take profit.
Entry: 0.81433
Why we like it:
There is an overlap support level that aligns with the 50% Fibonacci retracement.
Stop loss: 0.81065
Why we like it:
There is a pullback support level that is slightly above the 50% Fibonacci retracement.
Take profit: 0.81965
Why we like it:
There is a pullback resistance level.
Enjoying your TradingView experience? Review us!
Please be advised that the information presented on TradingView is provided to Vantage (‘Vantage Global Limited’, ‘we’) by a third-party provider (‘Everest Fortune Group’). Please be reminded that you are solely responsible for the trading decisions on your account. There is a very high degree of risk involved in trading. Any information and/or content is intended entirely for research, educational and informational purposes only and does not constitute investment or consultation advice or investment strategy. The information is not tailored to the investment needs of any specific person and therefore does not involve a consideration of any of the investment objectives, financial situation or needs of any viewer that may receive it. Kindly also note that past performance is not a reliable indicator of future results. Actual results may differ materially from those anticipated in forward-looking or past performance statements. We assume no liability as to the accuracy or completeness of any of the information and/or content provided herein and the Company cannot be held responsible for any omission, mistake nor for any loss or damage including without limitation to any loss of profit which may arise from reliance on any information supplied by Everest Fortune Group.

NZDCAD: Important Structure Breakout 🇳🇿🇨🇦
NZDCAD broke and closed above a significant
daily horizontal structure cluster.
The broken zone turned into a support now.
With a high probability, the pair will continue rising.
Next resistance - 0.82345
❤️Please, support my work with like, thank you!❤️

nzdcad buy tradeThe Relative Strength Index (RSI) is showing an upward trend, indicating increasing momentum. Additionally, the Moving Average Convergence Divergence (MACD) is showing a bullish crossover, further supporting the potential for an upward move.

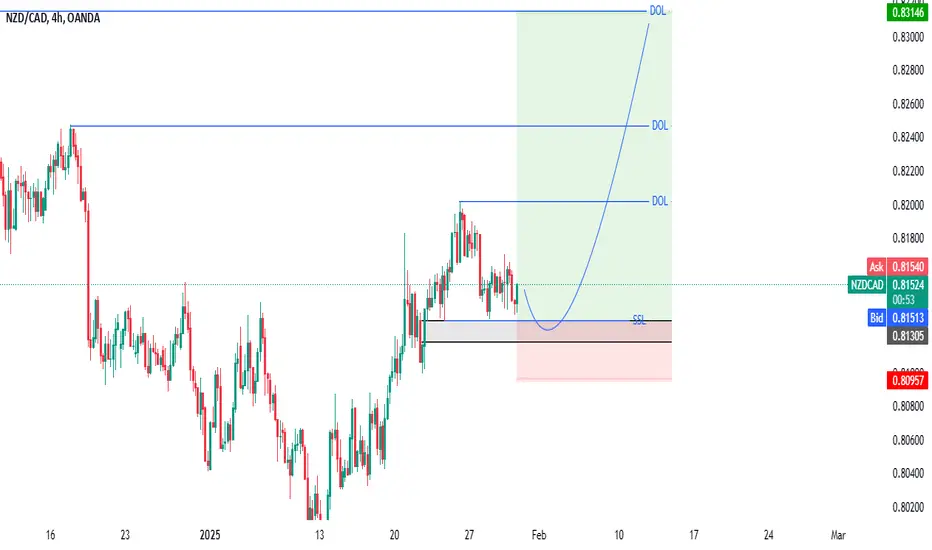
NZD/CAD "Kiwi vs Canadian" Forex Market Heist Plan on Bullish🌟Hi! Hola! Ola! Bonjour! Hallo!🌟
Dear Money Makers & Robbers, 🤑 💰
Based on 🔥Thief Trading style technical and fundamental analysis🔥, here is our master plan to heist the NZD/CAD "Kiwi vs Canadian Dollar" Forex market. Please adhere to the strategy I've outlined in the chart, which emphasizes long entry. Our aim is the high-risk Red Zone. Risky level, overbought market, consolidation, trend reversal, trap at the level where traders and bearish robbers are stronger. 👀 Be wealthy and safe trade.💪🏆🎉
Entry 📈 : You can enter a Bull trade after the MA Breakout,
however I advise placing Buy limit orders within a 15 or 30 minute timeframe. Entry from the most recent or closest low or high level should be in retest.
Stop Loss 🛑: Using the 2h period, the recent / nearest low or high level.
Goal 🎯: 0.82000 (or) Escape before the target
Scalpers, take note : only scalp on the Long side. If you have a lot of money, you can go straight away; if not, you can join swing traders and carry out the robbery plan. Use trailing SL to safeguard your money 💰.
Warning⚠️ : Our heist strategy is incompatible with Fundamental Analysis news 📰 🗞️. We'll wreck our plan by smashing the Stop Loss 🚫🚏. Avoid entering the market right after the news release.
Fundamental Outlook 📰🗞️
The NZD/CAD pair is expected to move in a bullish trend, driven by several fundamental factors:
New Zealand Economy:
Increase in dairy prices
Surge in tourism
Improvement in business confidence
Increase in consumer spending
Canadian Economy:
Decline in crude oil prices
Slowdown in the labor market
Decrease in housing market activity
Increase in trade deficits
Interest Rate Divergence:
Reserve Bank of New Zealand (RBNZ) keeps interest rates steady
Bank of Canada (BOC) cuts interest rates
Narrowing of the interest rate differential between the two currencies
Commodity Prices:
Increase in dairy prices
Increase in meat prices
Increase in other commodity prices that are important to New Zealand's economy
Currency Flows:
Increase in demand for the NZD
Decrease in demand for the CAD
Flows of capital into New Zealand's economy
Technical Analysis:
Breakout above the 0.80872 resistance level
Bullish chart patterns, such as a head and shoulders or a inverse head and shoulders
Bullish indicators, such as a moving average crossover or a relative strength index (RSI) MACD breakout
Sentiment Analysis:
Bullish sentiment among traders and investors
Increase in long positions in the NZD/CAD pair
Decrease in short positions in the NZD/CAD pair
Event-Driven Factors:
Positive news about New Zealand's economy, such as a new trade agreement
Negative news about Canada's economy, such as a natural disaster
Changes in government policies or regulations that affect the economies of New Zealand or Canada
These are just a few examples of the types of factors that could lead to a bullish trend for the NZD/CAD pair. As always, it's essential to monitor the market and adjust your trading strategy accordingly.
Please note that this is a general analysis and not personalized investment advice. It's essential to consider your own risk tolerance and market analysis before making any investment decisions.
Take advantage of the target and get away 🎯 Swing Traders Please reserve the half amount of money and watch for the next dynamic level or order block breakout. Once it is resolved, we can go on to the next new target in our heist plan.
Keep in mind that these factors can change rapidly, and it's essential to stay up-to-date with market developments and adjust your analysis accordingly.
💖Supporting our robbery plan will enable us to effortlessly make and steal money 💰💵 Tell your friends, Colleagues and family to follow, like, and share. Boost the strength of our robbery team. Every day in this market make money with ease by using the Thief Trading Style.🏆💪🤝❤️🎉🚀
I'll see you soon with another heist plan, so stay tuned 🫂

NZDCAD - Short after BOS !!Hello traders!
‼️ This is my perspective on NZDCAD.
Technical analysis: Here we are in a bearish market structure from daily timeframe perspective, so I look for a short. We can see that price rejected from bearish OB + level 0.82000. As well we have hidden divergence for sell.
On H1 we have regular divergence, so I wait for a short position after BOS.
Fundamental news: Upcoming week on Wednesday (GMT+2) we will see results of Interest Rate on CAD. News with high impact on currencies.
Like, comment and subscribe to be in touch with my content!

NZDCAD Is Going Down! Short!
Take a look at our analysis for NZDCAD.
Time Frame: 1D
Current Trend: Bearish
Sentiment: Overbought (based on 7-period RSI)
Forecast: Bearish
The market is approaching a significant resistance area 0.819.
Due to the fact that we see a positive bearish reaction from the underlined area, I strongly believe that sellers will manage to push the price all the way down to 0.809 level.
P.S
The term oversold refers to a condition where an asset has traded lower in price and has the potential for a price bounce.
Overbought refers to market scenarios where the instrument is traded considerably higher than its fair value. Overvaluation is caused by market sentiments when there is positive news.
Like and subscribe and comment my ideas if you enjoy them!

NZD/CAD Analysis: Liquidity and Supply Zone Reaction Timeframe: NZD/CAD Analysis: Liquidity and Supply Zone Reaction
Timeframe: 4-Hour
Overview:
This analysis focuses on the current price structure and potential setups for NZD/CAD. The market is approaching a significant point of interest (POI) at a supply zone, where a high probability of price reaction is expected. Key concepts such as liquidity grabs, imbalances, and market structure shifts are highlighted.
Key Observations:
Point of Interest (POI):
The supply zone marked between 0.8218 – 0.8258 represents an area where selling pressure previously overwhelmed buyers.
This zone aligns with previous price inefficiencies and an imbalance (imbL), making it a critical test for the current bullish momentum.
Liquidity to Take:
There’s visible liquidity resting above recent highs within the supply zone. This liquidity, highlighted as "lq to take," might attract price before a potential reversal occurs.
Smart money tends to grab liquidity before deciding the next directional move, making this a key area to watch.
Market Structure Shift (MSS):
The MSS level marked at the lower end of the chart indicates where the market shifted from a bearish to a bullish structure.
This bullish structure currently holds, but the POI could serve as a zone for a trend reversal or continuation after a retracement.
Imbalance:
The chart highlights an imbalance zone (imbL), representing an area where price moved too quickly, leaving inefficiencies in the market.
The imbalance is a magnet for price action, often serving as a draw for liquidity seekers.
Liquidity Target:
The diagonal line pointing towards "lq to target" illustrates how the market cleared sell-side liquidity before continuing upward.
The price appears to be in a liquidity-seeking phase, with the supply zone as the next likely target.
Trading Plan:
Scenario 1: Rejection from the Supply Zone
Confirmation: Watch for bearish candlestick patterns (e.g., engulfing or pin bars) in the supply zone. This signals sellers entering the market.
Entry: Enter short around 0.8218 – 0.8258, with confirmation from price action.
Stop-Loss: Above 0.8258 (beyond the zone).
Take-Profit: Target the recent liquidity sweep near 0.7998, aligning with previous demand.
Scenario 2: Breakout Above the Supply Zone
Confirmation: A strong break and close above 0.8258, followed by a pullback into the zone.
Entry: Enter long on a pullback into the broken zone (now demand).
Stop-Loss: Below 0.8218 (mid-range of the zone).
Take-Profit: Aim for higher levels, such as 0.8300+, based on higher timeframe structure.
Key Levels:
Supply Zone (Resistance): 0.8218 – 0.8258
Demand Zone (Support): 0.7998
Imbalance Zone: Around 0.8180
Conclusion:
NZD/CAD is at a critical juncture near a supply zone. Whether price rejects or breaks through will determine the next major move. Be patient and wait for price action confirmation before executing trades. This setup offers a solid risk-reward ratio for both reversal and continuation scenarios.
What do you think of this idea? Let me know your thoughts in the comments below, or feel free to share your perspective!

NZD/CAD Price Action Analysis (Daily Timeframe)NZD/CAD Price Action Analysis (Daily Timeframe)**
Overview:
The chart illustrates the NZD/CAD pair on a daily timeframe. It highlights a recent bullish rally after a sustained downtrend, with the price nearing a key resistance level. A potential rejection or breakout scenario could unfold in the coming sessions.
---
Key Observations:
1. Recent Bullish Momentum:
- The price has seen a strong bullish run in recent days, forming consecutive higher highs and higher lows. This indicates increasing buying pressure in the market.
- The bullish rally has brought the price into a significant supply zone, visible as a grey rectangle on the chart.
2. Supply Zone:
- The shaded grey area represents a supply zone around **0.8212 - 0.8252**, where selling pressure previously outweighed buying pressure, leading to price rejection.
- This zone is critical as it could either:
- Act as a reversal point, pushing the price back into a bearish trend.
- Lead to a breakout if buying pressure persists.
3. Rejection and Risk Management:
- A bearish candlestick pattern forming in this zone (e.g., shooting star, bearish engulfing) would signal a potential reversal.
- Stop-loss placement for potential sell entries is highlighted at **0.8252** (above the supply zone).
- The take-profit zone for a bearish setup is projected around **0.7992**, aligning with previous support levels.
4. Trend Context:
- Despite the bullish rally, the broader trend before this rally was bearish. This makes the current move a potential retracement, with the supply zone being a critical test for bulls.
- A clear close above **0.8252** could invalidate the bearish outlook and signal further bullish momentum.
5. Key Levels to Watch:
- **Resistance:** 0.8212 – 0.8252 (Supply Zone)
- **Support:** 0.7992 (Highlighted Take-Profit Zone)
- **Mid-Level Reaction:** 0.8100 (Round Number and Psychological Level)
6. Risk-Reward Analysis:
- The chart suggests a favorable risk-to-reward ratio for short positions, given the tight stop-loss above the supply zone and a relatively larger take-profit target.
---
#Possible Trading Scenarios:
1. Scenario 1: Bearish Rejection in Supply Zone
- Look for bearish candlestick confirmation within the supply zone.
- Entry: Near 0.8212 (upper range of the zone).
- Stop-Loss: Above 0.8252.
- Take-Profit: Around 0.7992 (previous support zone).
2. Scenario 2: Bullish Breakout Above Supply Zone
- A strong daily close above 0.8252 would signal a breakout.
- Entry: On a pullback to the broken zone.
- Stop-Loss: Below 0.8212.
- Take-Profit: Aiming for higher resistance levels (around 0.8350 or higher).
---
#Conclusion:
The NZD/CAD pair is at a critical juncture, testing a significant supply zone. Traders should monitor price action closely in this area, looking for confirmation before entering positions. The outcome in this zone will likely dictate the pair's next major move, offering opportunities for both breakout and reversal trades.

NZDCAD Will this Evening Star give us some nice pips? NZDCAD formed an evening star pattern. The name is not important but the price action (bullish trend followed by indecision and then by a strong bearish move) could be.
Time will tell.
Switch to your daily chart and note that all this is happening at a significant s/r level.
This is not a trade recommendation, merely my own analysis. Trading carries a high level of risk, so only trade with money you can afford to lose and carefully manage your capital and risk. If you like my idea, please give a “boost” and follow me to get even more. Please comment and share your thoughts too!!
It’s not whether you are right or wrong, but how much money you make when you are right and how much you lose when you are wrong – George Soros


NZDCADhelllo everyone,, there is BOS in Weekly tf, the day is also very bullish.. price is good for swing trade, wait for pullback to get in.. price may do small correction in small tf instead of higher tf since it very bullish.. price cross 200sma in 4hr which is possible the price will go for long...
good luck traders

