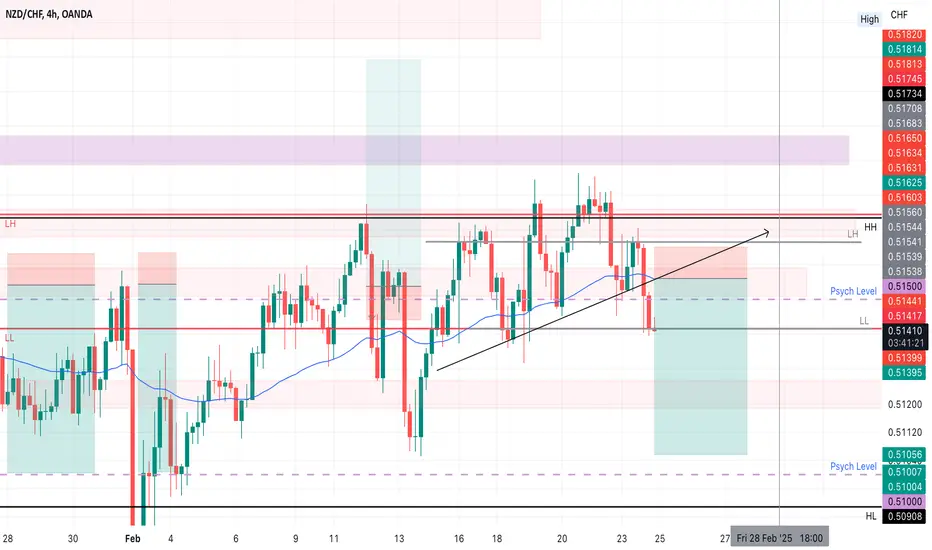
NZD/CHF Trade Setup: Long from Key SupportNZD/CHF is currently bouncing off a strong support zone, making it a potential long opportunity if buyers step in to defend this level.
🔹 Trade Setup:
✅ Entry: Near 0.510 - 0.511 (Support Zone)
🎯 Profit Target (Blue Zone): 0.517 - 0.518
🛑 Stop-Loss (Yellow Zone): Below 0.509
🔹 Market Outlook:
📊 Bullish Bias – Price is reacting to a well-established support zone. A break above 0.512 could confirm upside momentum.
⚠️ Risk Management – If price drops below 0.509, this trade setup becomes invalid.
Guide for Execution:
✅ No Martingale Strategy: Maintaining same position sizing for risk control.
✅ Remove Untriggered Orders: If the profit target is hit before entry, the pending order will be removed.
Will this support hold and push NZD/CHF higher? Watching closely for confirmation. Let me know your thoughts! 👇
NZDCHF trade ideas

NZDCHF: Another Liquidity Sweep Trade?! 🇳🇿🇨🇭
I see almost perfect liquidity grab on NZDCHF
after a test of a key daily demand zone.
Probabilities will be high that the price will at least pullback
from the underlined area to 0.5121 level.
❤️Please, support my work with like, thank you!❤️

Potential bullish rise?NZD/CHF is reacting off the pivot and could rise to the 1st resistance level.
Pivot: 0.5093
1st Support: 0.5060
1st Resistance: 0.5135
Risk Warning:
Trading Forex and CFDs carries a high level of risk to your capital and you should only trade with money you can afford to lose. Trading Forex and CFDs may not be suitable for all investors, so please ensure that you fully understand the risks involved and seek independent advice if necessary.
Disclaimer:
The above opinions given constitute general market commentary, and do not constitute the opinion or advice of IC Markets or any form of personal or investment advice.
Any opinions, news, research, analyses, prices, other information, or links to third-party sites contained on this website are provided on an "as-is" basis, are intended only to be informative, is not an advice nor a recommendation, nor research, or a record of our trading prices, or an offer of, or solicitation for a transaction in any financial instrument and thus should not be treated as such. The information provided does not involve any specific investment objectives, financial situation and needs of any specific person who may receive it. Please be aware, that past performance is not a reliable indicator of future performance and/or results. Past Performance or Forward-looking scenarios based upon the reasonable beliefs of the third-party provider are not a guarantee of future performance. Actual results may differ materially from those anticipated in forward-looking or past performance statements. IC Markets makes no representation or warranty and assumes no liability as to the accuracy or completeness of the information provided, nor any loss arising from any investment based on a recommendation, forecast or any information supplied by any third-party.

#026 Trust The Process NZDCHF Buy 1358SGT 25022025Buying at the Major Support Level as drawn and seen on the chart.
Very simple, S&R trading.
If you want additional confirmation, you could see that the immediate price action is that, price has swiped back up in a manner candlestick trading devotees call as, confirmation, or, reversal candle, or engulfing candle or marubozu candle, closing back into the range in a swift upward motion.
That's where I was stuck at previously, with such kind of fanciful names, patterns, etc.
Same could be said to ICT trading techniques, etc.
I haven't verify for myself if any of these ICT trading methods work or not, or if those signal providers who claim they use ICT methods to trade and am profitable(in the long run).
I am very curious though. But, I have spent too much time trying all kinds of bulls.
Now, I am just going to eat happily and be happy(LOL, I am listening to kaka rose live now and she is talking about the colleague whom left on her own because she keep posting on tiktok about how she is living a very frugal life and tough life by eating bread and cup noodles on live stream, tarnishing kaka rose's company image, when she is getting paid very very very well. In fact, she get paid 6 months bonus yearly, and kaka cooks for the entire company regularly for lunch.)
On weekends, she work another 30 hours, cleaning 3 to 4 houses on the side.
Bruh, I can't. What would a 58 years old auntie from china working in singapore living comfortably need so much money for? even when she is earning extremely well already, she chose to take up weekends jobs too?
1406SGT 25022025

NZDCHF SHORT Market structure bearish on HTFs DH
Entry at Daily AOi
Weekly Rejection at AOi
Daily Rejection at AOi
Daily EMA retest
Previous Structure point Daily
Round Psych Level 0.51500
H4 EMA retest
H4 Candlestick rejection
Rejection from Previous structure
Levels 5,6
Entry 95%
REMEMBER : Trading is a Game Of Probability
: Manage Your Risk
: Be Patient
: Every Moment Is Unique
: Rinse, Wash, Repeat!
: Christ is King.
NZDCHF"📉 NZDCHF Short Trade Update: Currently holding my sell position as the pair trades around 0.5149. The recent breach below the bullish trendline suggests potential for further downside. Monitoring key support levels at 0.5132 and 0.5128. Staying disciplined and adhering to the trading plan. #Forex #NZDCHF #TradingStrategy"

NZD/CHF "Kiwi vs Swiss" Forex Market Bullish Heist Plan🌟Hi! Hola! Ola! Bonjour! Hallo!🌟
Dear Money Makers & Thieves, 🤑 💰🐱👤
Based on 🔥Thief Trading style technical and fundamental analysis🔥, here is our master plan to heist the NZD/CHF "Kiwi vs Swiss" Forex market. Please adhere to the strategy I've outlined in the chart, which emphasizes long entry. Our aim is the high-risk Red Zone. Risky level, overbought market, consolidation, trend reversal, trap at the level where traders and bearish robbers are stronger. 🏆💸Be wealthy and safe trade.💪🏆🎉
Entry 📈 : "The vault is wide open! Swipe the Bullish loot at any price - the heist is on!
however I advise Place Buy limit orders within a 15 or 30 minute timeframe. Entry from the most recent or closest low or high level should be in retest.
Stop Loss 🛑: Thief SL placed at 0.51100 (swing Trade Basis) Using the 4H period, the recent / nearest low level.
SL is based on your risk of the trade, lot size and how many multiple orders you have to take.
Target 🎯: 0.52360 (or) Escape Before the Target
Scalpers, take note 👀 : only scalp on the Long side. If you have a lot of money, you can go straight away; if not, you can join swing traders and carry out the robbery plan. Use trailing SL to safeguard your money 💰.
📰🗞️Fundamental, Macro, COT, Sentimental Outlook:
NZD/CHF "Kiwi vs Swiss" Forex Market market is currently experiencing a bullish trend,., driven by several key factors.
🟤Fundamental Analysis
1. Economic Growth: New Zealand's economy is expected to grow at a rate of 2.5% in 2023, while Switzerland's economy is expected to grow at a rate of 1.5%.
2. Inflation: New Zealand's inflation rate is currently at 2.2%, while Switzerland's inflation rate is currently at 0.5%.
3. Interest Rates: The Reserve Bank of New Zealand (RBNZ) has kept interest rates at 3.5%, while the Swiss National Bank (SNB) has kept interest rates at -0.75%.
4. Trade Balance: New Zealand's trade balance is currently in deficit, while Switzerland's trade balance is currently in surplus.
🟣Macroeconomic Factors
1. Global Economic Trends: The global economy is expected to grow at a rate of 3.2% in 2023, with a potential slowdown in the second half of the year.
2. Commodity Prices: Commodity prices, such as gold and oil, are expected to remain volatile due to geopolitical tensions and supply chain disruptions.
3. Central Bank Policies: Central banks, such as the Federal Reserve and the European Central Bank, are expected to maintain a dovish monetary policy stance to support economic growth.
4. Fiscal Policies: Fiscal policies, such as government spending and taxation, are expected to remain expansionary in many countries to support economic growth.
🟡Technical Analysis
1. Trend: The current trend is bearish, with the NZD/CHF pair having declined by 5% over the past quarter.
2. Moving Averages: The 50-day moving average is below the 200-day moving average, indicating a bearish trend.
🔵Market Sentiment
1. Investor Sentiment: Institutional investors are 30% bullish, 40% bearish, and 30% neutral on the NZD/CHF pair.
2. Retail Sentiment: Retail investors are 40% bullish, 30% bearish, and 30% neutral on the NZD/CHF pair.
3. Market Mood: The overall market mood is cautious, with investors waiting for further economic data before making investment decisions.
🟠COT Report
1. Non-Commercial Traders: 25% long, 75% short
2. Commercial Traders: 30% long, 70% short
3. Non-Reportable Traders: 20% long, 80% short
🟢Positioning
1. Institutional Traders: 30% bullish, 40% bearish, 30% neutral
2. Banks: 25% bullish, 45% bearish, 30% neutral
3. Hedge Funds: 35% bullish, 35% bearish, 30% neutral
4. Corporate Traders: 20% bullish, 50% bearish, 30% neutral
5. Retail Traders: 40% bullish, 30% bearish, 30% neutral
🔴Overall Outlook
1. Bearish: The NZD/CHF pair is expected to decline due to the stronger Swiss franc and weaker New Zealand dollar.
2. Volatility: The NZD/CHF pair is expected to be volatile, with potential price swings of 5-10% in the short-term.
⚠️Trading Alert : News Releases and Position Management 📰 🗞️ 🚫🚏
As a reminder, news releases can have a significant impact on market prices and volatility. To minimize potential losses and protect your running positions,
we recommend the following:
Avoid taking new trades during news releases
Use trailing stop-loss orders to protect your running positions and lock in profits
📌Please note that this is a general analysis and not personalized investment advice. It's essential to consider your own risk tolerance and market analysis before making any investment decisions.
📌Keep in mind that these factors can change rapidly, and it's essential to stay up-to-date with market developments and adjust your analysis accordingly.
💖Supporting our robbery plan will enable us to effortlessly make and steal money 💰💵 Tell your friends, Colleagues and family to follow, like, and share. Boost the strength of our robbery team. Every day in this market make money with ease by using the Thief Trading Style.🏆💪🤝❤️🎉🚀
I'll see you soon with another heist plan, so stay tuned 🤑🐱👤🤗🤩

NzdchfNzdchf I find this trade really so interesting cause we have the market switch from a down trend to a up trend from 1w 1d 4h so we are definitely buying this trade

NZD/CHF SENDS CLEAR BEARISH SIGNALS|SHORT
Hello, Friends!
NZD/CHF pair is in the uptrend because previous week’s candle is green, while the price is clearly rising on the 4H timeframe. And after the retest of the resistance line above I believe we will see a move down towards the target below at 0.515 because the pair overbought due to its proximity to the upper BB band and a bearish correction is likely.
✅LIKE AND COMMENT MY IDEAS✅

MY NZDCHF BUY ANALYSIS.AS WE ALL KNOW. WE ARE IN A CLEARLY DOWN TREND ON NZDCHF,
While looking for opportunities on the charts, i was able to spotted this buy signals on NZDCHF.
i have tried explaining as much as i can on the video, so pls watch. Buy FX:NZDCHF @entry on the video.. i don't know why my mouse pointer is not indicting correctly, but pls try to understand my moves on the video. Thank you.

NZDCHF A Fall Expected! SELL!
My dear followers,
I analysed this chart on NZDCHF and concluded the following:
The market is trading on 0.5169 pivot level.
Bias - Bearish
Technical Indicators: Both Super Trend & Pivot HL indicate a highly probable Bearish continuation.
Target - 0.5158
About Used Indicators:
A super-trend indicator is plotted on either above or below the closing price to signal a buy or sell. The indicator changes color, based on whether or not you should be buying. If the super-trend indicator moves below the closing price, the indicator turns green, and it signals an entry point or points to buy.
———————————
WISH YOU ALL LUCK

long trade possible runner good r/r,in a trading range for a while has the pottential to run quite fast

NZDCHF: Expecting Bearish Continuation! Here is Why: `
Looking at the chart of NZDCHF right now we are seeing some interesting price action on the lower timeframes. Thus a local move down seems to be quite likely.
❤️ Please, support our work with like & comment! ❤️

WE MIGHT HAVE A BEARISH TRENDNZDCHF might push down since it is on our last LH of D1 but everything is explained on this video, feel free to correct me if you see that im making a mistake or comment if you want to.
NB:NO REVERSAL PATTERNS NO ENTRY.
I'LL TRY TO POST VIDEOS INSTEAD OF A PICTURE.

#007 Trust The Process NZDCHF Short 1238SGT 18022025Win = Win
Lose = Win
Use two accounts take trades on both directions. However, keep the opposing trade direction's position at 1.5R SL. The same amount as the main trade position's TP.
1239SGT 18022025
Not taking the opposing trade now. Imma let it run.
40% winrate = Breakeven
above 40% = Profit
Below 40% = Data
Regardless of what, you gonna gain something.
1240SGT 18022025

NZDCHFAB=CD is complete at the PRZ Divergence print .
also horizontal Support
my Bias is Bearish when beark 0.51417.
Sell Stop 0.51417
Stop Loss 0.51823
Take Profit 0.51012
RRR 1:1

nzdchf sell tradeThe Relative Strength Index (RSI) is showing a downward trend, indicating weakening momentum. Additionally, the Moving Average Convergence Divergence (MACD) is showing a bearish crossover, further supporting the potential for a downward move

NZD_CHF RISKY SHORT|
✅NZD_CHF is going up now
But a strong resistance level is ahead at 0.5178
Thus I am expecting a pullback
And a move down towards the target at 0.5160
SHORT🔥
✅Like and subscribe to never miss a new idea!✅

Sell NZDCHFPrice has rejected off of weekly high, interest rates are also expected to be announced during tomorrows Asian session which should give even greater bearish momentum.

nzdchfnzdchf is in the retest phase of the head and shoulders formation after the trend break. Short positions can be evaluated once the retest is completed.

NZDCHF SELL SETUPOANDA:NZDCHF Overall bias is bearish on NZDCHF. Price made a retest at the Daily AOI. Daily made a nice bearish engulfing on Thursday 13 February 2025, with it being my entry

NZDCHF Expected Growth! BUY!
My dear friends,
Please, find my technical outlook for NZDCHF below:
The instrument tests an important psychological level 0.5136
Bias - Bullish
Technical Indicators: Supper Trend gives a precise Bullish signal, while Pivot Point HL predicts price changes and potential reversals in the market.
Target - 0.5149
About Used Indicators:
Super-trend indicator is more useful in trending markets where there are clear uptrends and downtrends in price.
———————————
WISH YOU ALL LUCK

NZDCHF - Analysis and Potential Setups (Intraday- 14.02.25)Overall Trend & Context:
The pair is in an overall downtrend on the higher time frames and lower time frames.
Technical Findings:
Price is at strong levels of supply.
HTF oversold conditions.
Extreme zone is still valid.
Will look for re-entries on LTF's to get a better RR of this setup.
Potential Scenarios:
Potential to reach new lows at 0.50600 levels.
