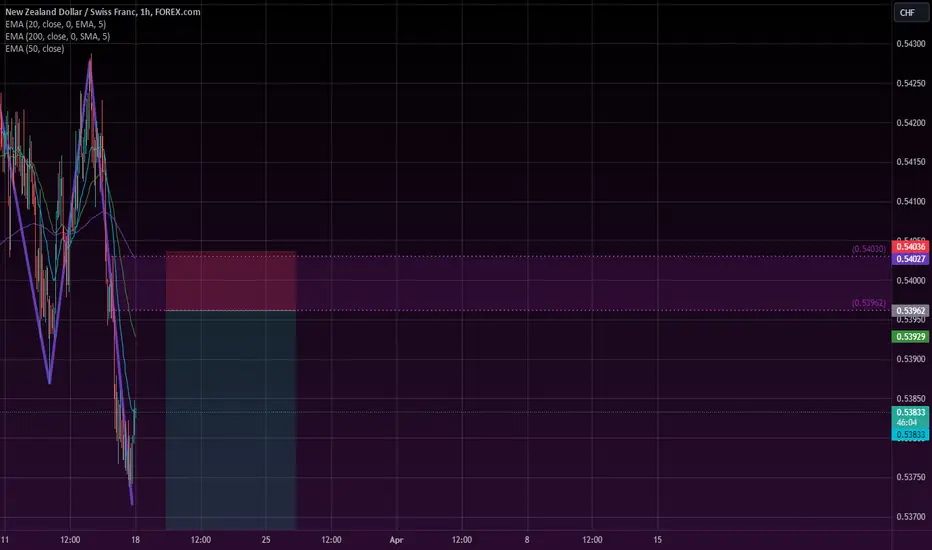
NZD/CHF Day Trading Analysis With Volume Profile 📊On NZD/CHF, it's nice to see a strong sell-off from the price of 0.53960. It's also encouraging to observe a strong volume area where a lot of contracts are accumulated.
I believe that sellers from this area will defend their short positions. When the price returns to this area, strong sellers will push the market down again.
The downtrend combined with the strong volume area along with the strong S/R area from the past are my main reasons for this short trade.
Happy trading,
Dale
NZDCHF trade ideas


Bearish engulfing at resistanceMonthly is bearish,
Weekly is still bearish
Daily had a string push down below resistance.

NZD/CHF Trend is BearishCertainly, here's a precise summary of "Lower High" and "Lower Low" with bullet points:
**Lower High:**
- **Definition**:
- In technical analysis, a "lower high" occurs when the peak in the price of an asset is lower than the previous highest peak.
- **Indicator of Downward Momentum**:
- Suggests a potential reversal or continuation of a downward trend in the price of the asset.
- **Interpretation**:
- Reflects decreasing buying pressure and negative market sentiment.
- Implies a possible shift from bullish to bearish momentum.
- **Usage**:
- Traders may use lower highs to identify potential selling opportunities or to confirm a downtrend.
- Combined with other indicators such as decreasing trading volume, it strengthens the bearish signal.
- **Strategy**:
- Short-selling or exiting long positions may be considered to profit from the expected downward movement.
- Implementing risk management techniques like setting stop-loss orders is crucial to mitigate potential losses.
**Lower Low:**
- **Definition**:
- A "lower low" is observed in technical analysis when the trough in the price of an asset falls below the previous lowest trough.
- **Indicator of Continued Downward Trend**:
- Indicates the persistence of bearish sentiment and the likelihood of further price declines.
- **Interpretation**:
- Highlights sustained selling pressure and negative market sentiment.
- Confirms the presence of a downtrend and discourages bullish expectations.
- **Usage**:
- Traders may use lower lows to confirm the continuation of a bearish trend or to identify potential entry points for short positions.
- Supporting evidence from indicators like decreasing trading volume can strengthen the bearish outlook.
- **Strategy**:
- Short-selling or holding off on buying positions until signs of a trend reversal emerge could be considered.
- Employing risk management strategies such as trailing stop-loss orders is essential to manage potential risks.

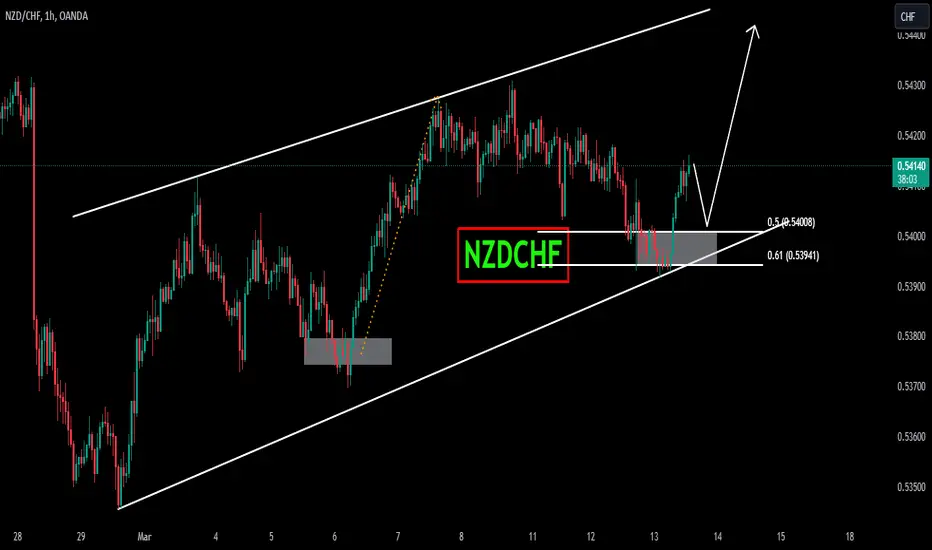
NZDCHF Trading IdeaBased on Simple Technical Analysis ( Trendline + Support & Resistance )
Risk Disclaimer:
Please be advised that I am not telling anyone how to spend or invest their money. Take all of my analysis as my own opinion, as entertainment, and at your own risk. I assume no responsibility or liability for any errors or omissions in the content of this page, and they are for educational purposes only. Any action you take on the information in these analysis is strictly at your own risk. There is a very high degree of risk involved in trading. Past results are not indicative of future returns. Good luck :-)

NZDCHF Short TradeMARKET PHASE
OANDA:NZDCHF is in a long term downtrend (daily) with a short term corrective structure that has been taking place (4 hour).
AREA OF VALUE
There was a buildup of liquidity (buy stops, longs, short stop losses) above the corrective structure swing highs. Price violently moved up to trigger the buy stops (liquidity) to pair against the sell orders needed to take price down. Price has started it`s initial move down but due to the velocity of the downward move, it's gapped some orders around 0.54224. Price is likely to retrace to this level before continuing downwards.
TRADE
I will be entering short on OANDA:NZDCHF with the following parameters:
Sell Limit: 0.54224
Stop Loss: 0.54295
Take Profit: 0.54082

NZD/CHF BEARS ARE GAINING STRENGTH|SHORT
Hello,Friends!
It makes sense for us to go short on NZD/CHF right now from the resistance line above with the target of 0.540 because of the confluence of the two strong factors which are the general downtrend on the previous 1W candle and the overbought situation on the lower TF determined by it’s proximity to the upper BB band.
✅LIKE AND COMMENT MY IDEAS✅

NZDCHF BEARISH CONTINUATIONPossible bearish continuation of the pair with the target of hitting the low made 29/02/2024.
If the price breaks and closes below the current low this could be a good low to look for rejections on retest for continuations lower.
Key Levels to note:
1. High made on 27/02/2023
2. Low made on 29/02/2024
3. Break below the above will be looking at the low made on 06/02/2024
4. Price should remain below 0.54315 to keep sell bias sin place.

Quick Sell IdeaFor learning purpose only, this chart might plummet to the downside to the 0 entry. This is risky and counter trend, the pair may simply just continue shooting up

Potential Bearish TriangleAs with the AUDCHF, we have almost a copy-and-paste triangle pattern, but on this NZDCHF, the market still looks to be constructing the leg 'd' of the triangle, if all factors hold on, we should see a dive to the rising Trendline and back up for wave 'e' before we see a full and free fall.
Firstly this pattern was spotted on March 7th, and the development is interesting.
Strictly this isn't an investment idea but aimed for education and learning the EW.


NZDCHF - 15M - BEARISH FLAG - SHORT POSITIONIn this chart we have spotted BEARISH DIVERGENCE which is played upto mark and after that we can see a BEARISH FLAG which identify a suitable short target and take an entry & exit points accordingly.

NZDCHF: Short Trading Opportunity
NZDCHF
- Classic bearish pattern
- Our team expects retracement
SUGGESTED TRADE:
Swing Trade
Sell NZDCHF
Entry - 0.5413
Stop - 0.5426
Take - 0.5390
Our Risk - 1%
Start protection of your profits from lower levels
❤️ Please, support our work with like & comment! ❤️

Buy Idea on CHFJPYExpecting a long-term buy on the pair. High chances they'll run a stop loss hunt and ultimately start buying from the 0 Drawback entry.
Dotted lines are for sculping opportunities.
Regards,

NZDCHF: Confirmed Bullish Signal?! 🇳🇿🇨🇭
NZDCHF nicely respected a solid rising trend line on a daily.
We see a confirmed violation of a resistance line of a falling wedge pattern on a 4h time frame.
We can anticipate growth now at least to 0.5422
❤️Please, support my work with like, thank you!❤️

NZDCHFNZDCHF is in strong bullish trend.
As the market is consistently printing new HHs and HLs.
currently the market is retracing a bit after last HH, which is 50% Fib retracement level and local support as well. if the market successfully sustain this selling confluence the next leg lower could go for new HH.
What you guys think of this idea?
NZDCHF - Upside move ✅Hello traders!
‼️ This is my perspective on NZDCHF.
Technical analysis: Here we are in a bullish market structure from 4H timeframe perspective, so I am looking for a long. I expect bullish price action from here as price mitigated bullish order block and could reject from institutional big figure 0.54000.
Like, comment and subscribe to be in touch with my content!

NZDCHF: Expecting Bullish Movement! Here is Why:
The price of NZDCHF will most likely increase soon enough, due to the demand beginning to exceed supply which we can see by looking at the chart of the pair.
❤️ Please, support our work with like & comment! ❤️

NZDCHF SELLExpecting price to sell to 0.53475, it has broken the trendline and filled the market imbalance (corrective move).

Bearish PossibilityIt seems price will be playing out as per my previous TA. I have adjusted my SL as I did not place it according to ATR and was stopped out. My bias is still a bearish move with at least 2 targets.

NZDCHF IS IN BULLISH TREND NZDCHF is in bullish trend it print Higher High and Higher Low on 1H time frame last two bullish candles show the buyer are dominating my trade plane mentioned in charts

