Could the price drop from here?EUR/NZD is reacting off the pivot and could drop to the 1st support which aligns with the 38.2% Fibonacci retracement.
Pivot: 1.84535
1st Support: 1.82654
1st Resistance: 1.85426
Risk Warning:
Trading Forex and CFDs carries a high level of risk to your capital and you should only trade with money you can afford to lose. Trading Forex and CFDs may not be suitable for all investors, so please ensure that you fully understand the risks involved and seek independent advice if necessary.
Disclaimer:
The above opinions given constitute general market commentary, and do not constitute the opinion or advice of IC Markets or any form of personal or investment advice.
Any opinions, news, research, analyses, prices, other information, or links to third-party sites contained on this website are provided on an "as-is" basis, are intended only to be informative, is not an advice nor a recommendation, nor research, or a record of our trading prices, or an offer of, or solicitation for a transaction in any financial instrument and thus should not be treated as such. The information provided does not involve any specific investment objectives, financial situation and needs of any specific person who may receive it. Please be aware, that past performance is not a reliable indicator of future performance and/or results. Past Performance or Forward-looking scenarios based upon the reasonable beliefs of the third-party provider are not a guarantee of future performance. Actual results may differ materially from those anticipated in forward-looking or past performance statements. IC Markets makes no representation or warranty and assumes no liability as to the accuracy or completeness of the information provided, nor any loss arising from any investment based on a recommendation, forecast or any information supplied by any third-party.
NZDEUR trade ideas

EUR-NZD Potential Long! Buy!
Hello,Traders!
EUR-NZD is going down
Now but the pair will
Soon hit a horizontal
Support level of 1.8371
So after the retest we
Will be expecting a
Local bullish rebound
Buy!
Comment and subscribe to help us grow!
Check out other forecasts below too!

Bullish bounce off pullback support?EUR/NZD is falling towards the support level which is a pullback support that aligns with the 23.6% Fibonacci retracement and could bounce from this level to our take profit.
Entry: 1.83656
Why we like it:
There is a pullback support level that aligns with the 23.6% Fibonacci retraecment.
Stop loss: 1.82385
Why we like it:
There is a pullback support level that lines up with the 38.2% Fibonacci retracement.
Take profit: 1.85286
Why we like it:
There is a pullback resistance level.
Enjoying your TradingView experience? Review us!
Please be advised that the information presented on TradingView is provided to Vantage (‘Vantage Global Limited’, ‘we’) by a third-party provider (‘Everest Fortune Group’). Please be reminded that you are solely responsible for the trading decisions on your account. There is a very high degree of risk involved in trading. Any information and/or content is intended entirely for research, educational and informational purposes only and does not constitute investment or consultation advice or investment strategy. The information is not tailored to the investment needs of any specific person and therefore does not involve a consideration of any of the investment objectives, financial situation or needs of any viewer that may receive it. Kindly also note that past performance is not a reliable indicator of future results. Actual results may differ materially from those anticipated in forward-looking or past performance statements. We assume no liability as to the accuracy or completeness of any of the information and/or content provided herein and the Company cannot be held responsible for any omission, mistake nor for any loss or damage including without limitation to any loss of profit which may arise from reliance on any information supplied by Everest Fortune Group.

EURNZD-REVERSALEURNZD is reversing its trend as it has made bearish divergence on the completion od AB=CD PATTREN

Bearish Reversal is impending1DYOR, This is not a financial advice. I have been following up on this pair on a weekly tf. I will be looking for downward trend from my POI and a SL above the daily resistance. I will keep updating the idea as the trade goes.
Goodluck. Wagmi

EurNZN analysisPrice already broke resistance level, now we waiting for retest it and bounce, then open long, to previous high tp

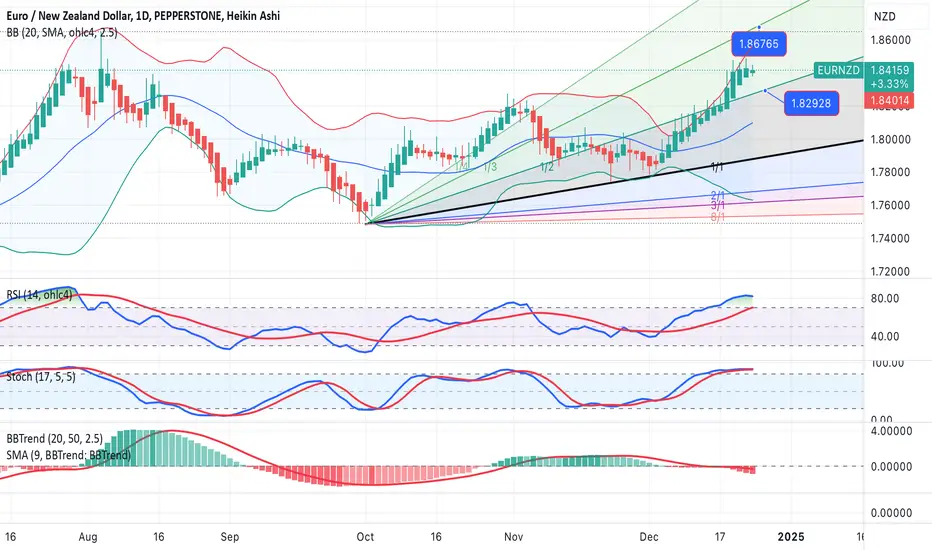
EurNzd could rise to 1.85On October 1st, EUR/NZD reached a local low at the psychological level of 1.75, followed by a reversal that lasted until November 1st, gaining nearly 1300 pips.
A normal correction then occurred, and from mid-November, the pair started consolidating between the 1.78 and 1.80 levels.
December brought a breakout above the key 1.80 level, and since then, EUR/NZD has been in a nice uptrend.
As of now, the price is 1.8230, and it looks like a breakout above resistance is imminent.
In this scenario, the next target for the bulls is the 1.85 level.

eurnzdits made a head and shoulder pattern and just got broken its neck line so I entered with instant execution

EUR/NZD 2H Price Action Analysis.This chart highlights a potential distribution phase forming near the recent highs, signaling a possible shift from the bullish trend to a bearish trend.
Key Observations:
The price recently formed higher highs (HH) and higher lows (HL), maintaining a bullish structure.
A key support zone is marked, which could act as a turning point if broken.
The projection anticipates a breakdown below the support zone, followed by a series of lower highs (LH) and lower lows (LL)—confirming a bearish market structure.
Plan Ahead:
If price breaks and retests the support zone, it could offer short opportunities targeting lower levels, as indicated in the forecast. Traders should watch for bearish confirmations like rejections or bearish engulfing patterns before entering trades.
Risk Management Tip:
Always manage risk with proper stop-loss placement and position sizing.

EURNZD: Time to Sell? Let's Delve In!Analyzing EUR/NZD's current dynamics, it's an opportune moment to consider opening a sell position. Here's why: the EASY Trading AI signals suggest a downward trend, making this a promising time to act.
Let's break down the specifics. We recommend entering the market at 1.84156, with a take profit poised at 1.83704. This target maximizes the potential falling momentum, ensuring we capitalize on predicted market shifts. Our stop loss is strategically placed at 1.84767, offering a buffer against unforeseen upticks, protecting capital from unexpected market volatility.
Why a sell position? Several factors align. Recent market analysis points towards an overbalance in EUR/NZD, with indicators showing bearish tendencies. The current economic climate, notably divergent monetary policies and interest rate expectations between Europe and New Zealand, further bolster the downside thesis.
The EASY Trading AI strategy pinpoints these market asymmetries, continually scanning conditions to validate entry points. Ensuring precise modeling and integration of historical data enhances our forecast accuracy.
For traders keen on automating their experience, our ready-made strategies in MT5 align with these insights, offering seamless integration.
In essence, consider the broader economic signals and technical cues as the EUR/NZD navigates this sell tide. Keep disciplined, and as always, trade wisely!

EUR/NZD SELLERS WILL DOMINATE THE MARKET|SHORT
Hello, Friends!
The BB upper band is nearby so EUR-NZD is in the overbought territory. Thus, despite the uptrend on the 1W timeframe I think that we will see a bearish reaction from the resistance line above and a move down towards the target at around 1.802.
✅LIKE AND COMMENT MY IDEAS✅

Bullish bounce off pullback support?EUR/NZD is falling towards the pivot which acts as a pullback support and could bounce to the pullback resistance.
Pivot: 1.82659
1st Support: 1.81404
1st Resistance: 1.84519
Risk Warning:
Trading Forex and CFDs carries a high level of risk to your capital and you should only trade with money you can afford to lose. Trading Forex and CFDs may not be suitable for all investors, so please ensure that you fully understand the risks involved and seek independent advice if necessary.
Disclaimer:
The above opinions given constitute general market commentary, and do not constitute the opinion or advice of IC Markets or any form of personal or investment advice.
Any opinions, news, research, analyses, prices, other information, or links to third-party sites contained on this website are provided on an "as-is" basis, are intended only to be informative, is not an advice nor a recommendation, nor research, or a record of our trading prices, or an offer of, or solicitation for a transaction in any financial instrument and thus should not be treated as such. The information provided does not involve any specific investment objectives, financial situation and needs of any specific person who may receive it. Please be aware, that past performance is not a reliable indicator of future performance and/or results. Past Performance or Forward-looking scenarios based upon the reasonable beliefs of the third-party provider are not a guarantee of future performance. Actual results may differ materially from those anticipated in forward-looking or past performance statements. IC Markets makes no representation or warranty and assumes no liability as to the accuracy or completeness of the information provided, nor any loss arising from any investment based on a recommendation, forecast or any information supplied by any third-party.

EURNZD-SELL strategy Daily chartThe pair has been ranging between 1.8465 and 1.8380 area. Overall picture is negative and we should see a test of 1.8300 support coming sessions. The good think about this pair, we can clearly observe an extreme oversold NZDUSD and EURUSD seems subdued, but has some chance to move higher aswell. NZDUSD will outperform that move and that is why this cross has a good potential to see lower.
Strategy SELL @ 1.8390-1.8440 and take profit near 1.8275 for now.
EUR-NZD Will Keep Growing! Buy!
Hello,Traders!
EUR-NZD is trading in an
Uptrend and the pair is
Making a bullish rebound
From the horizontal support
Of 1.8371 so we are bullish
Biased and we will be
Expecting a further
Bullish move up
Buy!
Comment and subscribe to help us grow!
Check out other forecasts below too!

eurnzdEURNZD broke the wedge it formed on the hourly basis. After the retest, it will continue to fall until 1.8250.

eurnzd sell signal. Don't forget about stop-loss.
Write in the comments all your questions and instruments analysis of which you want to see.
Friends, push the like button, write a comment, and share with your mates - that would be the best THANK YOU.
P.S. I personally will open entry if the price will show it according to my strategy.
Always make your analysis before a trade

EUR/NZD SHORT FROM RESISTANCEHello Traders
In This Chart EURNZD 4 HOURLY Forex Forecast By FOREX PLANET
today EURNZD analysis 👆
🟢This Chart includes EURNZD market update)
🟢What is The Next Opportunity on EURNZD Market
🟢how to Enter to the Valid Entry With Assurance Profit
This CHART is For Trader's that Want to Improve Their Technical Analysis Skills and Their Trading By Understanding How To Analyze The Market Using Multiple Timeframes and Understanding The Bigger Picture on the Charts

EURNZD-SELL strategy 9 hourly chart GANN SQThe pair starts looking tired and the likely false bull flag pattern, and overbought status, suggests we may see move lower to 1.8330 area short-term.
Strategy SELL range 1.8420-1.8450 and take profit near 1.8334 for now.

EURNZD Developing in a Large Range Trading MovementEURNZD Developing in a Large Range Trading Movement
EURNZD is currently developing a significant range trading movement. The price has been oscillating between 1.7500 and 1.8500 for about 600 days, with a trading range of nearly 1000 pips, which is quite substantial.
EURNZD has reached the top of the structure again, and it appears that the bearish trend may resume, as it has in the past. The price may not move immediately, but it is already in a critical zone.
Support zones on the way down are located near 1.8250, 1.8090, 1.7830, and 1.7500.
You may find more details in the chart!
Thank you and Good Luck!
❤️PS: Please support with a like or comment if you find this analysis useful for your trading day❤️

EURNZD I Short from top of the channel Welcome back! Let me know your thoughts in the comments!
** EURNZD Analysis - Listen to video!
We recommend that you keep this pair on your watchlist and enter when the entry criteria of your strategy is met.
Please support this idea with a LIKE and COMMENT if you find it useful and Click "Follow" on our profile if you'd like these trade ideas delivered straight to your email in the future.
Thanks for your continued support!Welcome back! Let me know your thoughts in the comments!

EURNZD - Bullish TrendThe chart is making series of HH and HL without any divergence. Hence, will be Bullish

EURNZDThe potential BUY scenario for the pair
The pair is to be monitored as it approaches the designated BUY zone on the chart.
