NZDJPY I Weekly CLS I Model 1 I 50% CLS Targeto Market Warriors ⚔️
Fresh outlook drop — if you’ve been riding with me, you already know:
🎯My system is 100% mechanical. No emotions. No trend lines. No subjective guessing. Just precision, structure, and sniper entries.
🧠 What’s CLS?
It’s the real smart money. The invisible hand behind $7T/day — banks, algos, central players.
📍Model 1:
HTF bias based on the daily and weekly candles closes,
Wait for CLS candle to be created and manipulated. Switch to correct LTF and spot CIOD. Enter and target 50% of the CLS candle.
For high probability include Dealing Ranges, Weekly Profiles and CLS Timing.
Analysis done on the Tradenation Charts
Disclosure: I am part of Trade Nation's Influencer program and receive a monthly fee for using their TradingView charts in my analysis.
Trading is like a sport. If you consistently practice you can learn it.
“Adapt what is useful. Reject whats useless and add whats is specifically yours.”
David Perk aka Dave FX Hunter
💬 Don't hesitate to ask any questions or share your opinions
NZDJPY trade ideas

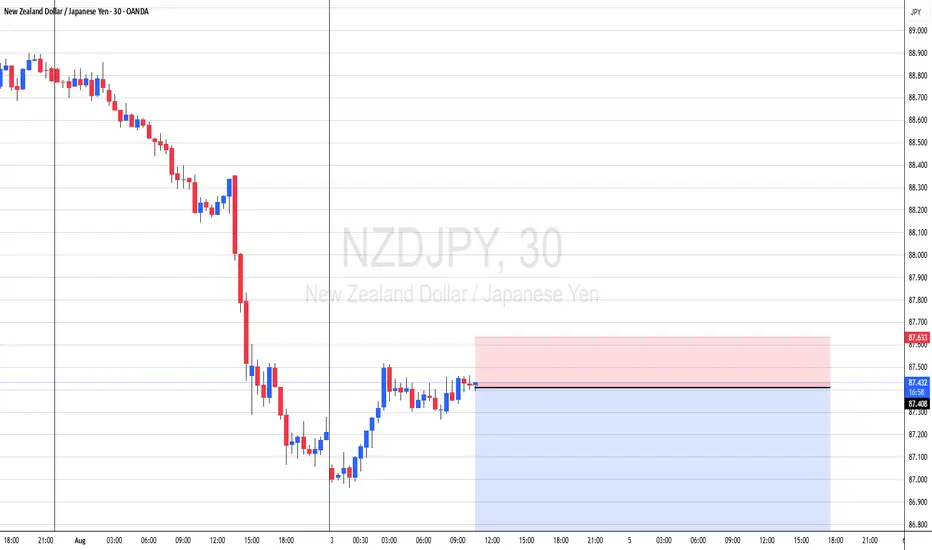
NZD-JPY Will Go Down! Sell!
Hello,Traders!
NZD-JPY made a retest
Of the horizontal resistance
Level of 87.700 from where
We are already seeing a bearish
Reaction so we area locally
Bearish biased and we will
Be expecting a local
Bearish move down
Sell!
Comment and subscribe to help us grow!
Check out other forecasts below too!
Disclosure: I am part of Trade Nation's Influencer program and receive a monthly fee for using their TradingView charts in my analysis.

LONG ON NZD/JPYNZD/JPY has given us a CHOC (change of character) on the lower timeframe after finding support.
I expect NJ to pullback to demand and then rise to the next level of supply for over 100 pips.

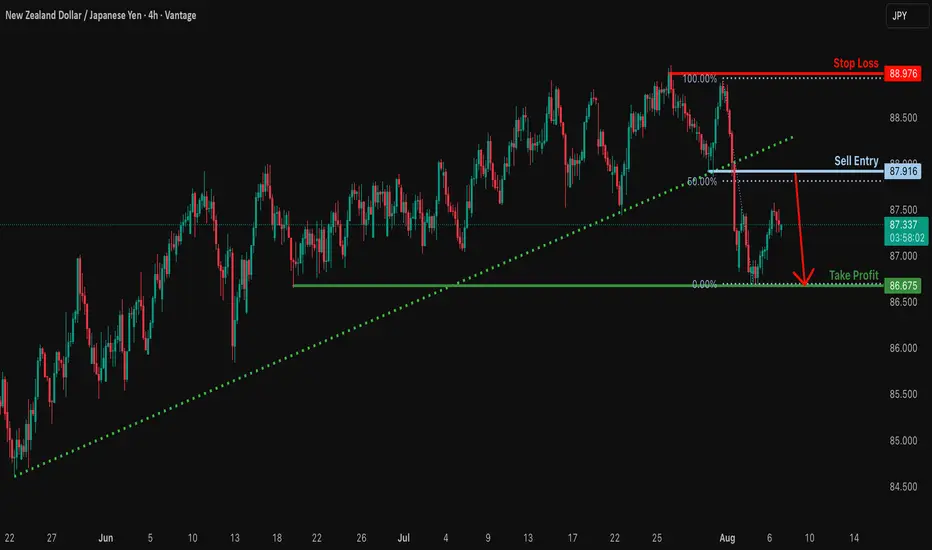
Bearish reversal?NZD/JPY is rising towards the resistance level which is a pullback resistance that aligns with the 50% Fibonacci retracement and could drop from this level to our take profit.
Entry: 87.91
Why we like it:
There is a pullback resistance that lines up with the 50% Fibonacci retracement.
Stop loss: 88.97
Why we like it:
There is a multi swing high resistance.
Take profit: 86.67
Why we like it:
There is amulti swing low support.
Enjoying your TradingView experience? Review us!
Please be advised that the information presented on TradingView is provided to Vantage (‘Vantage Global Limited’, ‘we’) by a third-party provider (‘Everest Fortune Group’). Please be reminded that you are solely responsible for the trading decisions on your account. There is a very high degree of risk involved in trading. Any information and/or content is intended entirely for research, educational and informational purposes only and does not constitute investment or consultation advice or investment strategy. The information is not tailored to the investment needs of any specific person and therefore does not involve a consideration of any of the investment objectives, financial situation or needs of any viewer that may receive it. Kindly also note that past performance is not a reliable indicator of future results. Actual results may differ materially from those anticipated in forward-looking or past performance statements. We assume no liability as to the accuracy or completeness of any of the information and/or content provided herein and the Company cannot be held responsible for any omission, mistake nor for any loss or damage including without limitation to any loss of profit which may arise from reliance on any information supplied by Everest Fortune Group.
NZDJPY Bearish Setup Unfolding: Key Shorting Zones & TargetsThe NZDJPY pair is showing a significant shift in structure on the daily timeframe, indicating a potential bearish reversal. This blog post provides a comprehensive breakdown of the setup using multi-timeframe confluence, including psychological levels, structure breaks, and key areas of interest (AOIs) for short entries and targets.
Key Zones to Watch
1. AOI Resistance - Weekly Zone (Supply Area)
Range: ~88.50 to 89.50
This red zone represents heavy resistance based on past supply and is aligned with the 200 EMA and a psychological round number level at 88.000.
A close above this zone invalidates the short setup.
2. Structure Break & Retest Zone
The chart shows a clean structure shift near the 88.00 level on the 4HR timeframe.
Price is expected to retest this zone. If rejected with bearish confirmation, it presents an ideal short entry.
This level is key for traders waiting for a pullback before confirmation.
3. AOI Support - Daily & Weekly
Target 1 (Phase 1): Daily AOI Support near 85.000
Target 2 (Phase 2): Weekly AOI Support near 81.000
Potential Short Entry Conditions:
Wait for a retest of the structure shift zone (around 88.00).
Look for bearish candlestick confirmation on lower timeframes (4H or 1H).
Avoid premature entry until structure confirmation and rejection is visible.
Psychological & Technical Confluence
The Psychological level at 88.00 is a strong confluence zone.
Aligned with the 200 EMA – often used as dynamic resistance.
Multiple failed breakout attempts near the upper resistance band show seller dominance.
The bearish momentum from the last few sessions adds further confidence.
Bearish Scenario Breakdown
Phase 1: A move from the current structure retest toward the daily AOI (~85.00).
Phase 2: If momentum continues, a deeper drop toward the weekly AOI (~81.00) could unfold.
Rejection or consolidation near the green AOI zones could mark a potential end or reversal point.
The NZDJPY pair is presenting a technically sound short setup supported by multi-timeframe confluence. The structure shift near 88.00 is the key area to monitor. With proper confirmation and execution, this trade offers an excellent risk-to-reward opportunity targeting the 85.00 and 81.00 levels.
=================================================================
Disclosure: I am part of Trade Nation's Influencer program and receive a monthly fee for using their TradingView charts in my analysis.
=================================================================

Is NZD/JPY the Next Bullish Vault Breach? Target: 89.000💰 NZD/JPY – Thief's Layered Strike Plan | Bullish FX Heist 🚀💹
🌍 What’s up, Market Bandits?!
Welcome to the Thief Trader Vault — where trades aren't guessed… they're executed with stealth 🕵️♂️💼. Today's blueprint? We're cracking into the NZD/JPY vault with a layered limit order raid – the perfect setup for real FX tacticians.
🎯 Plan: Full Bullish Operation – Precision Infiltration 🔥
The Thief Method hits different — we don't chase price, we trap it.
We’re placing multiple limit orders like laser tripwires, stacked and ready to ambush price movement on the way to our vault 💣.
💸 Entry: ANY Price Level — Layered Style 😎
This ain’t “wait for confirmation” talk — this is calculated chaos:
🔹 Multiple limit orders, like a sniper grid
🔹 Let price dip, retrace, or fakeout — we’re in regardless
🔹 Stack 'em like bricks and let price come to YOU
🔑 “Smart thieves don’t knock — they build secret doors.”
🛡️ Stop Loss: 86.500 – Guard the Loot 🎯
No games. No leaks.
Set your SL at 86.500 – below structural defense lines.
🔒 Capital protection is king. Hit, grab, bounce.
🎯 Target: 89.000 – Vault Exit Point 💎
When we hit 89.000, we unload the bag 💼
Optional: Trail your SL and squeeze more juice if momentum breaks high.
🧠 “Exit with impact. Leave no trace.”
⚙️ Strategy Style – For Real Ones Only:
👟 Scalpers:
Tap in on micro pullbacks. Hit & run style.
🎯 Ride with momentum — no shorts, no detours.
🛠️ Swing Traders:
You’re the long-haul vault opener. Stay locked in.
Use patience as your weapon — let the plan cook.
🧠 Market Backing – This Isn’t Just Hype:
🔸 JPY showing weakness across risk pairs
🔸 Global sentiment leaning risk-on
🔸 Cross-market confluence backing NZD strength
🔸 Liquidity voids above — ripe for targeting
⚠️ Risk Management = Real Trader Behavior
🚨 Avoid jumping during high-impact news
🧱 Trail your SL if you're already in profit
📉 This ain't gambling. It's probability warfare
💬 Final Words – Boost The Bandit Blueprint 📣
🔥 SMASH that ❤️ if this plan speaks your language.
🔁 DROP a comment if you’re layering up with the crew.
We don’t follow the herd — we rob the market 🥷💹
📌 Stay silent. Stay sharp. Stay rich.
— Thief Trader 💼⚡

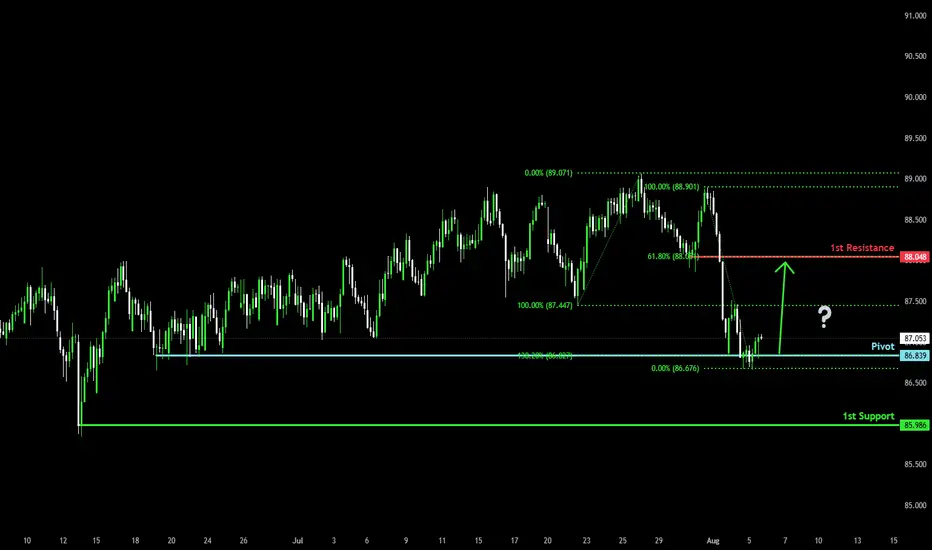
Bullish reversal?NZD/JPY is reacting off the pivot and could bounce to the 1st resistance which acts as a pullback resistance.
Pivot: 86.83
1st Support: 85.98
1st Resistance: 88.04
Risk Warning:
Trading Forex and CFDs carries a high level of risk to your capital and you should only trade with money you can afford to lose. Trading Forex and CFDs may not be suitable for all investors, so please ensure that you fully understand the risks involved and seek independent advice if necessary.
Disclaimer:
The above opinions given constitute general market commentary, and do not constitute the opinion or advice of IC Markets or any form of personal or investment advice.
Any opinions, news, research, analyses, prices, other information, or links to third-party sites contained on this website are provided on an "as-is" basis, are intended only to be informative, is not an advice nor a recommendation, nor research, or a record of our trading prices, or an offer of, or solicitation for a transaction in any financial instrument and thus should not be treated as such. The information provided does not involve any specific investment objectives, financial situation and needs of any specific person who may receive it. Please be aware, that past performance is not a reliable indicator of future performance and/or results. Past Performance or Forward-looking scenarios based upon the reasonable beliefs of the third-party provider are not a guarantee of future performance. Actual results may differ materially from those anticipated in forward-looking or past performance statements. IC Markets makes no representation or warranty and assumes no liability as to the accuracy or completeness of the information provided, nor any loss arising from any investment based on a recommendation, forecast or any information supplied by any third-party.
BUY NZDJPYA double bottom pattern has emerged on NZDJPY 1 hour chart. We will see price escalate in the next coming hours.

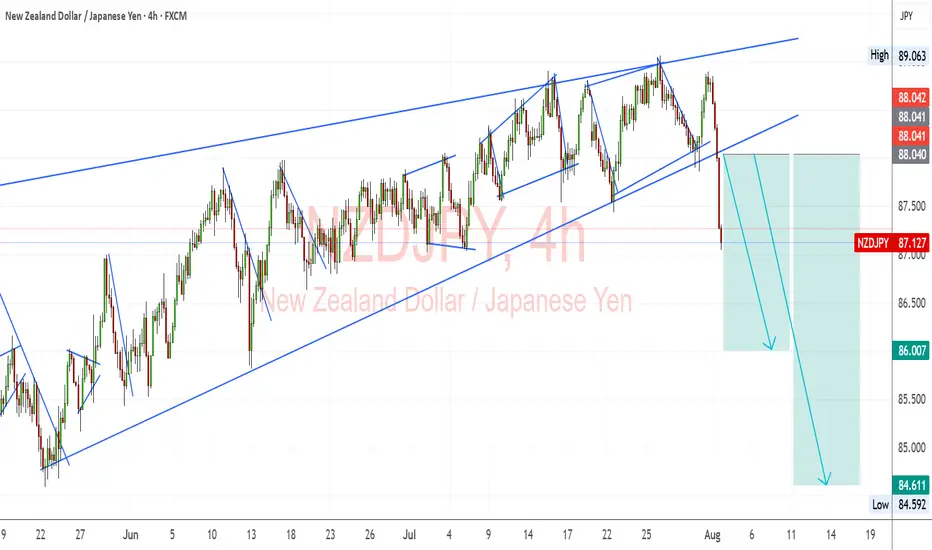
NZD/JPY: Bearish Breakdown from Ascending ChannelNZD/JPY has decisively broken below its ascending channel, signaling a shift from bullish structure to bearish momentum. This move aligns with fundamental headwinds for NZD and the potential for JPY strength amid intervention risks and global risk-off sentiment.
Technical Analysis (4H Chart)
Pattern: Breakout from ascending channel support confirms a bearish reversal.
Current Level: 87.12, trading below the broken trendline with strong selling pressure.
Key Support Levels:
86.00 – first bearish target and immediate support zone.
84.60 – extended bearish target if momentum continues.
Resistance Levels:
88.04 – previous support turned resistance.
89.06 – upper boundary and invalidation zone for bearish bias.
Projection: Price is expected to retest 86.00, and if broken, further decline toward 84.60 is likely.
Fundamental Analysis
Bias: Bearish.
Key Fundamentals:
NZD: Pressured by global tariffs and risk-off sentiment.
JPY: Supported by potential FX intervention from Japan’s Ministry of Finance and safe-haven demand.
US Data Impact: Weak NFP boosted Fed cut bets, but risk-off flows strengthen JPY against risk currencies like NZD.
Risks:
China stimulus or a risk-on shift could lift NZD.
Lack of BOJ action may weaken JPY temporarily.
Key Events:
RBNZ policy outlook.
BOJ comments or intervention signals.
US CPI influencing global risk sentiment.
Leader/Lagger Dynamics
NZD/JPY is a lagger, reacting to risk sentiment and JPY moves, with JPY strength leading the pair lower.
Summary: Bias and Watchpoints
NZD/JPY is bearish, with a clear technical break from its ascending channel. The pair targets 86.00 initially and 84.60 on extended downside. Key watchpoints include BOJ FX policy, RBNZ stance, and global risk sentiment, especially if markets move deeper into risk-off mode.
NZDJPY 1H Sell SetupWe can see that NZDJPY has induced (IDM) and taken out the buy side liquidity, after that the market broke through the resistance area and rapidly came back in with high volume. Now we focus on the Price leg it created which has 1H order block +_ fvg for selling opportunities.

nzdjpyThis pair is confusing people but the true is that it will fall strong.
Let´s go.
Blessings.
"passiveincomes" in signal start.
I see you there.
NZDJPY to find sellers at market price?NZDJPY - 24h expiry
Trading has been mixed and volatile.
Price action looks to be forming a top.
We look for a temporary move higher.
Preferred trade is to sell into rallies.
Bespoke resistance is located at 88.90.
We look to Sell at 88.90 (stop at 89.10)
Our profit targets will be 88.10 and 87.90
Resistance: 89.00 / 89.20 / 89.50
Support: 88.40 / 88.10 / 87.90
Risk Disclaimer
The trade ideas beyond this page are for informational purposes only and do not constitute investment advice or a solicitation to trade. This information is provided by Signal Centre, a third-party unaffiliated with OANDA, and is intended for general circulation only. OANDA does not guarantee the accuracy of this information and assumes no responsibilities for the information provided by the third party. The information does not take into account the specific investment objectives, financial situation, or particular needs of any particular person. You should take into account your specific investment objectives, financial situation, and particular needs before making a commitment to trade, including seeking, under a separate engagement, as you deem fit.
You accept that you assume all risks in independently viewing the contents and selecting a chosen strategy.
Where the research is distributed in Singapore to a person who is not an Accredited Investor, Expert Investor or an Institutional Investor, Oanda Asia Pacific Pte Ltd (“OAP“) accepts legal responsibility for the contents of the report to such persons only to the extent required by law. Singapore customers should contact OAP at 6579 8289 for matters arising from, or in connection with, the information/research distributed.

NZDJPY?Hi,
Just classic- Head & Shoulders
Not fancy .. whatever.
Keep it simple & patience.
Not going for the hype.
All the best
Not a guru


NZDJPY ShortNZDJPY is now net short on the regression break.
I am considering all JPY pairs as it appears a market correction may build.

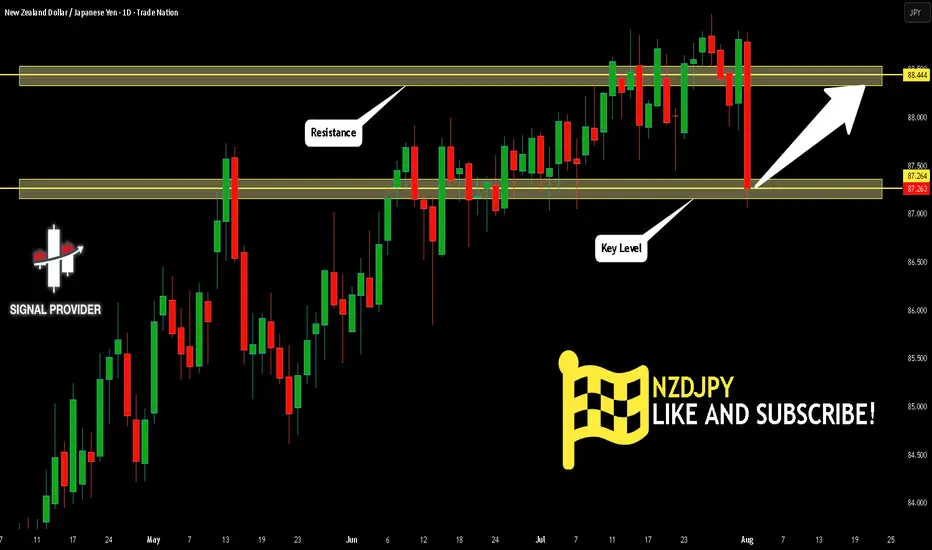
NZDJPY Will Go Up! Buy!
Here is our detailed technical review for NZDJPY.
Time Frame: 1D
Current Trend: Bullish
Sentiment: Oversold (based on 7-period RSI)
Forecast: Bullish
The market is testing a major horizontal structure 87.264.
Taking into consideration the structure & trend analysis, I believe that the market will reach 88.444 level soon.
P.S
Overbought describes a period of time where there has been a significant and consistent upward move in price over a period of time without much pullback.
Disclosure: I am part of Trade Nation's Influencer program and receive a monthly fee for using their TradingView charts in my analysis.
Like and subscribe and comment my ideas if you enjoy them!
NZD-JPY Local Long! Buy!
Hello,Traders!
NZD-JPY is retsting a
Strong horizontal support
Level around 87.044 and
As the pair is locally
Oversold we will be expecting
A local rebound and a move
Up on Monday!
Buy!
Comment and subscribe to help us grow!
Check out other forecasts below too!
Disclosure: I am part of Trade Nation's Influencer program and receive a monthly fee for using their TradingView charts in my analysis.

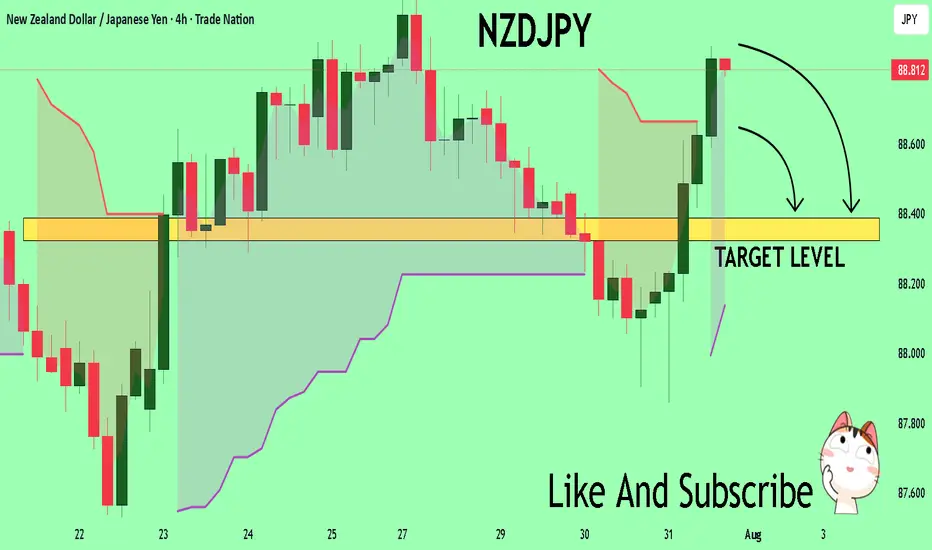
NZDJPY The Target Is DOWN! SELL!
My dear friends,
Please, find my technical outlook for NZDJPY below:
The price is coiling around a solid key level - 88.806
Bias - Bearish
Technical Indicators: Pivot Points Low anticipates a potential price reversal.
Super trend shows a clear sell, giving a perfect indicators' convergence.
Goal - 88.388
About Used Indicators:
The pivot point itself is simply the average of the high, low and closing prices from the previous trading day.
Disclosure: I am part of Trade Nation's Influencer program and receive a monthly fee for using their TradingView charts in my analysis.
———————————
WISH YOU ALL LUCK
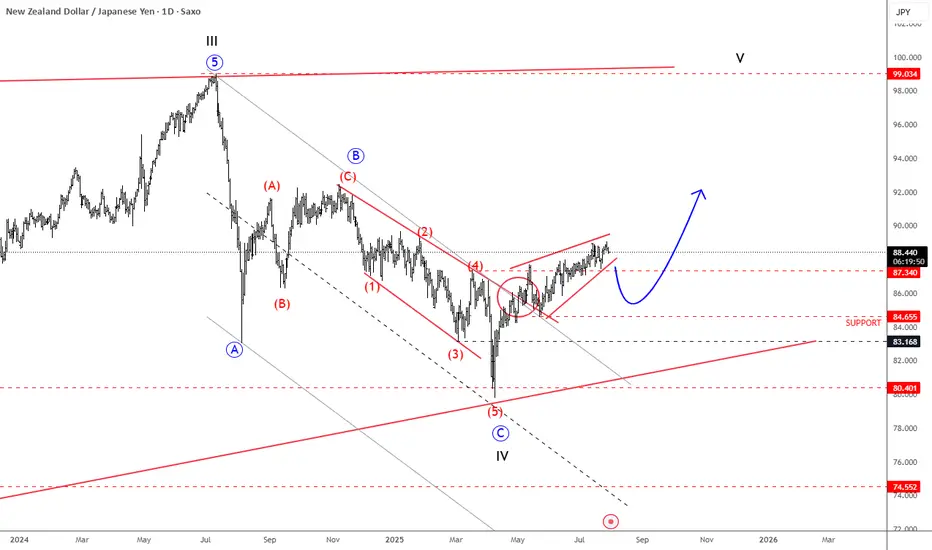
NZDJPY Is Back To Bullish ModeNZDJPY Is Back To Bullish Mode from technical and Elliott wave perspective, as we see it breaking back above trendline after a corrective decline.
NZDJPY is nicely recovering over the last few weeks after a strong rebound from 80.40 support, a key level going back to March 2023. Notice that it’s recovering after a three-wave ABC corrective decline that belongs to a higher degree wave IV correction. Current recovery looks to be in five waves, as a leading diagonal; so its a motive wave structure that already pushed above the 87.34 resistance, which is a strong bullish signal, suggesting more upside ahead. Of course, short-term pullbacks are always possible and welcome, and in that case, the 86 – 84 area could act as a nice support. But overall, we think that sooner or later the pair will target the 90 or even 92 levels, which are still possible this year. Wave V is eyeing even 100 area.
NZDJPY: Bullish Continuation
The recent price action on the NZDJPY pair was keeping me on the fence, however, my bias is slowly but surely changing into the bullish one and I think we will see the price go up.
Disclosure: I am part of Trade Nation's Influencer program and receive a monthly fee for using their TradingView charts in my analysis.
❤️ Please, support our work with like & comment! ❤️

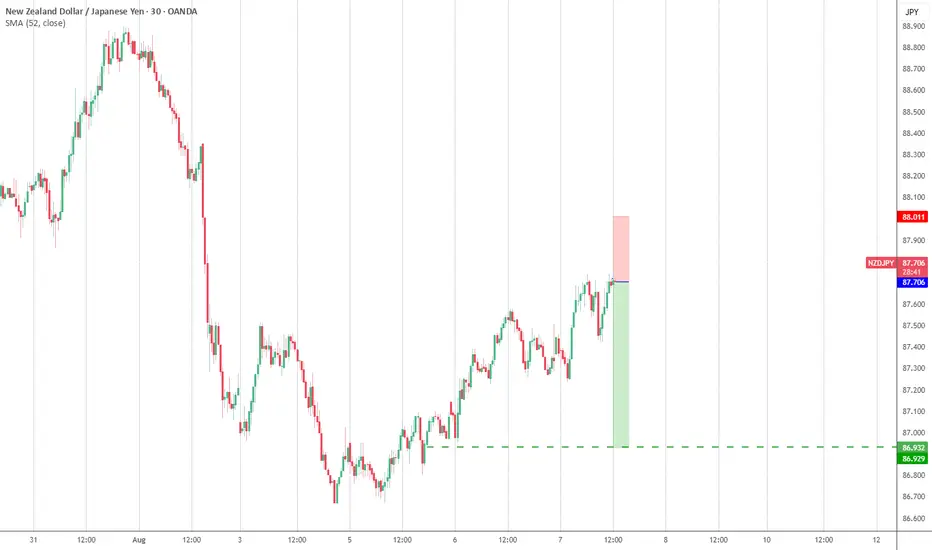
NZDJPY: Free Trading Signal
NZDJPY
- Classic bullish pattern
- Our team expects retracement
SUGGESTED TRADE:
Swing Trade
Buy NZDJPY
Entry - 88.612
Stop - 88.524
Take - 88.757
Our Risk - 1%
Start protection of your profits from lower levels
Disclosure: I am part of Trade Nation's Influencer program and receive a monthly fee for using their TradingView charts in my analysis.
❤️ Please, support our work with like & comment! ❤️

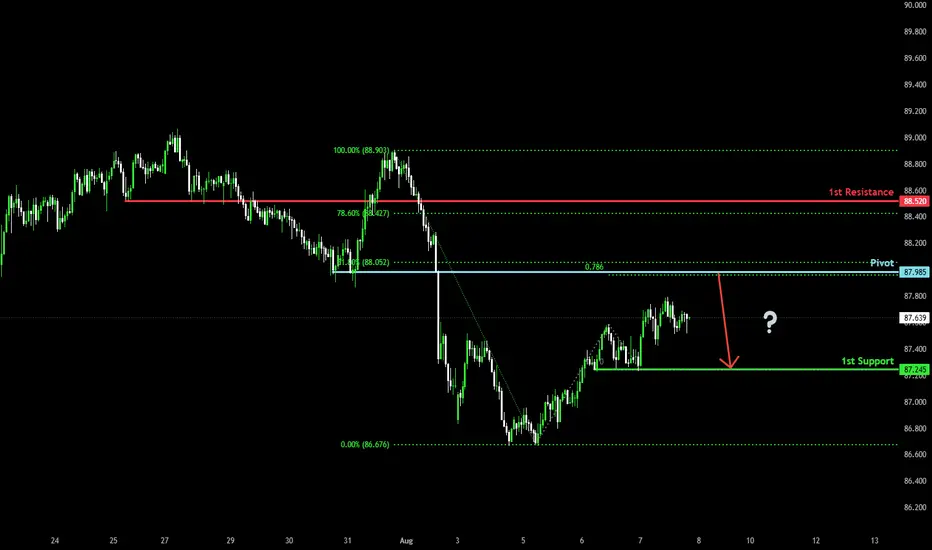
Bearish reversal off pullback resistance?NZD/JPY is rising towards the pivot, which acts as a pullback resistance that is slightly below the 61.8% Fibonacci retracement and could reverse to the 1st support.
Pivot: 87.98
1st Support: 87.24
1st Resistance: 88.52
Risk Warning:
Trading Forex and CFDs carries a high level of risk to your capital and you should only trade with money you can afford to lose. Trading Forex and CFDs may not be suitable for all investors, so please ensure that you fully understand the risks involved and seek independent advice if necessary.
Disclaimer:
The above opinions given constitute general market commentary, and do not constitute the opinion or advice of IC Markets or any form of personal or investment advice.
Any opinions, news, research, analyses, prices, other information, or links to third-party sites contained on this website are provided on an "as-is" basis, are intended only to be informative, is not an advice nor a recommendation, nor research, or a record of our trading prices, or an offer of, or solicitation for a transaction in any financial instrument and thus should not be treated as such. The information provided does not involve any specific investment objectives, financial situation and needs of any specific person who may receive it. Please be aware, that past performance is not a reliable indicator of future performance and/or results. Past Performance or Forward-looking scenarios based upon the reasonable beliefs of the third-party provider are not a guarantee of future performance. Actual results may differ materially from those anticipated in forward-looking or past performance statements. IC Markets makes no representation or warranty and assumes no liability as to the accuracy or completeness of the information provided, nor any loss arising from any investment based on a recommendation, forecast or any information supplied by any third-party.