NZD/JPY BEST PLACE TO SELL FROM|SHORT
NZD/JPY SIGNAL
Trade Direction: short
Entry Level: 84.696
Target Level: 82.624
Stop Loss: 86.074
RISK PROFILE
Risk level: medium
Suggested risk: 1%
Timeframe: 8h
Disclosure: I am part of Trade Nation's Influencer program and receive a monthly fee for using their TradingView charts in my analysis.
✅LIKE AND COMMENT MY IDEAS✅
NZDJPY trade ideas

NZDJPY: Market of Sellers
Balance of buyers and sellers on the NZDJPY pair, that is best felt when all the timeframes are analyzed properly is shifting in favor of the sellers, therefore is it only natural that we go short on the pair.
Disclosure: I am part of Trade Nation's Influencer program and receive a monthly fee for using their TradingView charts in my analysis.
❤️ Please, support our work with like & comment! ❤️

Bullish bounce?NZD/JPY is falling towards the pivot and could bounce to the 1st resistance.
Pivot: 83.52
1st Support: 82.38
1st Resistance: 85.13
Risk Warning:
Trading Forex and CFDs carries a high level of risk to your capital and you should only trade with money you can afford to lose. Trading Forex and CFDs may not be suitable for all investors, so please ensure that you fully understand the risks involved and seek independent advice if necessary.
Disclaimer:
The above opinions given constitute general market commentary, and do not constitute the opinion or advice of IC Markets or any form of personal or investment advice.
Any opinions, news, research, analyses, prices, other information, or links to third-party sites contained on this website are provided on an "as-is" basis, are intended only to be informative, is not an advice nor a recommendation, nor research, or a record of our trading prices, or an offer of, or solicitation for a transaction in any financial instrument and thus should not be treated as such. The information provided does not involve any specific investment objectives, financial situation and needs of any specific person who may receive it. Please be aware, that past performance is not a reliable indicator of future performance and/or results. Past Performance or Forward-looking scenarios based upon the reasonable beliefs of the third-party provider are not a guarantee of future performance. Actual results may differ materially from those anticipated in forward-looking or past performance statements. IC Markets makes no representation or warranty and assumes no liability as to the accuracy or completeness of the information provided, nor any loss arising from any investment based on a recommendation, forecast or any information supplied by any third-party.

NZDJPY to continue in the sequence of lower highs?NZDJPY - 24h expiry
The primary trend remains bearish.
The rally is close to a correction count on the daily chart.
The RSI is trending lower.
Bearish divergence is expected to cap gains.
Bespoke resistance is located at 84.50.
Preferred trade is to sell into rallies.
We look to Sell at 84.50 (stop at 85.15)
Our profit targets will be 81.90 and 81.50
Resistance: 85.00 / 85.50 / 86.30
Support: 83.20 / 82.25 / 81.85
Risk Disclaimer
The trade ideas beyond this page are for informational purposes only and do not constitute investment advice or a solicitation to trade. This information is provided by Signal Centre, a third-party unaffiliated with OANDA, and is intended for general circulation only. OANDA does not guarantee the accuracy of this information and assumes no responsibilities for the information provided by the third party. The information does not take into account the specific investment objectives, financial situation, or particular needs of any particular person. You should take into account your specific investment objectives, financial situation, and particular needs before making a commitment to trade, including seeking advice from an independent financial adviser regarding the suitability of the investment, under a separate engagement, as you deem fit.
You accept that you assume all risks in independently viewing the contents and selecting a chosen strategy.
Where the research is distributed in Singapore to a person who is not an Accredited Investor, Expert Investor or an Institutional Investor, Oanda Asia Pacific Pte Ltd (“OAP“) accepts legal responsibility for the contents of the report to such persons only to the extent required by law. Singapore customers should contact OAP at 6579 8289 for matters arising from, or in connection with, the information/research distributed.

NZDJPY The Target Is DOWN! SELL!
My dear friends,
Please, find my technical outlook for NZDJPY below:
The instrument tests an important psychological level 84.401
Bias - Bearish
Technical Indicators: Supper Trend gives a precise Bearish signal, while Pivot Point HL predicts price changes and potential reversals in the market.
Target - 82.960
Recommended Stop Loss - 85.188
About Used Indicators:
Super-trend indicator is more useful in trending markets where there are clear uptrends and downtrends in price.
Disclosure: I am part of Trade Nation's Influencer program and receive a monthly fee for using their TradingView charts in my analysis.
———————————
WISH YOU ALL LUCK

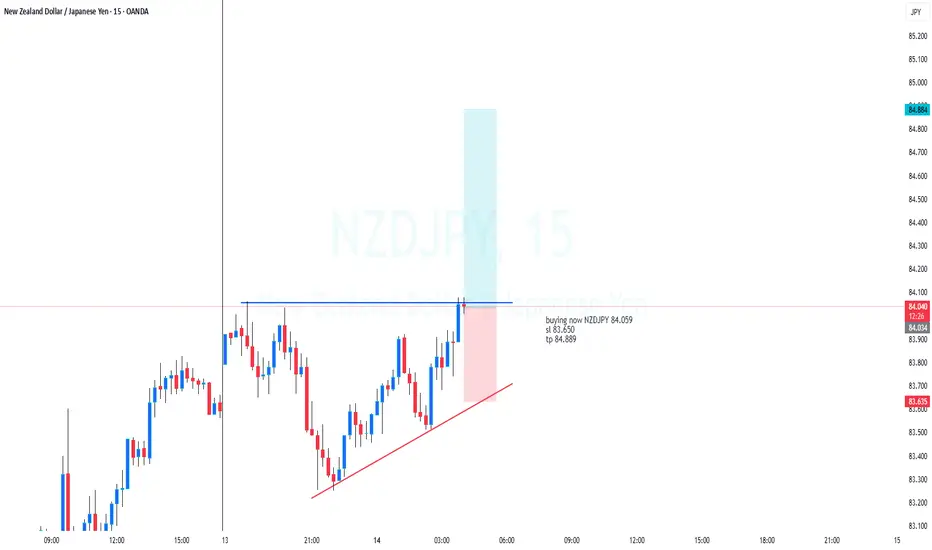
Double bottomThe price has made a double bottom pattern followed by a breakout and a pullback which came inform of a trendline and now we have a breakout and pullback again, which provides an opportunity to go long
WE ONLY TRADE PULLBACKS


NZD_JPY SHORT SIGNAL|
✅NZD_JPY went up and
Retested the horizontal
Resistance above around 85.023
So we are locally bearish biased
And we can now take a short
Trade with the TP of 83.645
And the SL of 85.405
SHORT🔥
✅Like and subscribe to never miss a new idea!✅
Disclosure: I am part of Trade Nation's Influencer program and receive a monthly fee for using their TradingView charts in my analysis.

NZD-JPY Will Fall! Sell!
Hello,Traders!
NZD-JPY went up sharply
But then hit a horizontal
Resistance of 85.069
From where we are already
Seeing a bearish pullback
So we will be expecting
A local bearish move down
Sell!
Comment and subscribe to help us grow!
Check out other forecasts below too!
Disclosure: I am part of Trade Nation's Influencer program and receive a monthly fee for using their TradingView charts in my analysis.

NZDJPY clean rejection Looks like a clean rejection from the AOI.
Now we wait for an entry and the right market… no signal no trade.
Let see what happens.

NZDJPY: Market of Sellers
Our strategy, polished by years of trial and error has helped us identify what seems to be a great trading opportunity and we are here to share it with you as the time is ripe for us to sell NZDJPY.
Disclosure: I am part of Trade Nation's Influencer program and receive a monthly fee for using their TradingView charts in my analysis.
❤️ Please, support our work with like & comment! ❤️

Could the price reverse from here?NZD/JPY us rising towards the pivot an could reverse to the 1st support.
Pivot: 85.30
1st Support: 84.12
1st Resistance: 86.71
Risk Warning:
Trading Forex and CFDs carries a high level of risk to your capital and you should only trade with money you can afford to lose. Trading Forex and CFDs may not be suitable for all investors, so please ensure that you fully understand the risks involved and seek independent advice if necessary.
Disclaimer:
The above opinions given constitute general market commentary, and do not constitute the opinion or advice of IC Markets or any form of personal or investment advice.
Any opinions, news, research, analyses, prices, other information, or links to third-party sites contained on this website are provided on an "as-is" basis, are intended only to be informative, is not an advice nor a recommendation, nor research, or a record of our trading prices, or an offer of, or solicitation for a transaction in any financial instrument and thus should not be treated as such. The information provided does not involve any specific investment objectives, financial situation and needs of any specific person who may receive it. Please be aware, that past performance is not a reliable indicator of future performance and/or results. Past Performance or Forward-looking scenarios based upon the reasonable beliefs of the third-party provider are not a guarantee of future performance. Actual results may differ materially from those anticipated in forward-looking or past performance statements. IC Markets makes no representation or warranty and assumes no liability as to the accuracy or completeness of the information provided, nor any loss arising from any investment based on a recommendation, forecast or any information supplied by any third-party.

nzdjpy looking like a snack this morning might get that close above back into our buy zone to possible retrace to fill some gaps.. before going back into its current bearish trend..

Potential bullish rise?NZD/JPY has bounced off the support level which is an overlap support and could rise from this level to our take profit.
Entry: 83.42
Why we like it:
There is an overlap support level.
Stop loss: 82.42
Why we like it:
There is a pullback support level.
Take profit: 85.16
Why we like it:
There is an overlap resistance level that aligns with the 78.6% Fibonacci retracement.
Enjoying your TradingView experience? Review us!
Please be advised that the information presented on TradingView is provided to Vantage (‘Vantage Global Limited’, ‘we’) by a third-party provider (‘Everest Fortune Group’). Please be reminded that you are solely responsible for the trading decisions on your account. There is a very high degree of risk involved in trading. Any information and/or content is intended entirely for research, educational and informational purposes only and does not constitute investment or consultation advice or investment strategy. The information is not tailored to the investment needs of any specific person and therefore does not involve a consideration of any of the investment objectives, financial situation or needs of any viewer that may receive it. Kindly also note that past performance is not a reliable indicator of future results. Actual results may differ materially from those anticipated in forward-looking or past performance statements. We assume no liability as to the accuracy or completeness of any of the information and/or content provided herein and the Company cannot be held responsible for any omission, mistake nor for any loss or damage including without limitation to any loss of profit which may arise from reliance on any information supplied by Everest Fortune Group.

NZDJPY → Back in range, there's a chance to strengthenFX:NZDJPY is forming a false break of the range support and within the reversal pattern confirms the break of the bearish structure
The fundamental background has been extremely unstable lately and depends on any harsh statements of politicians, mainly related to the trade war.
But, technically, the pair is returning to the range on the background of local market recovery. A false breakdown of the range support is formed.
The break of the bearish structure, the formation of the reversal pattern and the return to the trading range give chances for strengthening of the price. If the bulls hold the defense above 83.7 - 84.2, the currency pair may strengthen to 85.15 - 87.4
Resistance levels: 84.196, 86.15
Support levels: 83.79, 83.31, 82.21
Consolidation above the key support zone may allow the bulls to strengthen the price to the local zone of interest. Global trend is neutral, local trend is upward.
Regards R. Linda!

NZDJPY Upside BreakoutPrice has broken to the upside of the Friday high. Looking to trade with existing momentum to the upside, with a tight stop above the recent 1h swing low.

NZDJPY TRADE SETUPWait for retest the entry level then take a trade for Buy otherwise skip this setup

a sell setup on Nzdjpyusing smc model we see an untapped breaker block above before price made the impulse downward movement. price created a clear inducement which is our liquidity to take the trade with high RR ratio. cheers guys and dont forget tto tell me what you think.

NZD/JPY For Bearishyou can go short now
or
wait for pull-back near by entry point and then go short
general trend is down trend
have fun :)

NZDJPY We expect New Zealand to rise against the Japanese yen, but on the condition that the 84.138 area is broken to 83.875, and we target 86.318. But we must be careful because of geopolitical news, as any sudden decision completely changes the issues of analysis.

NZDJPY DTF Chart – Technical & Fundamental AnalysisNZDJPY DTF Chart – Technical & Fundamental Analysis
On the DTF chart, NZDJPY is currently forming a consistent pattern of lower highs and lower lows, clearly signaling a bearish trend. The price has broken through several minor key levels — first at 86.800, then 85.000, and has now reached the minor key support at 82.500, which we identify as our Change of Character (ChoCH) zone.
After the breakdown below 82.500, the market started accumulating sell-side pressure from pending orders placed on the breakout. Now, price is moving toward a key liquidity zone, targeting stop-losses from those early sellers — a classic liquidity hunt move.
As of now, we have not yet seen a clear liquidity structure inside the zone. Our strategy is to wait for liquidity to form, and once confirmed, we’ll enter the market with the following setup:
🔍 Trade Setup:
Sell Stop Entry: 82.370
Stop-Loss (SL): 85.140 (above the liquidity zone to absorb possible wicks)
Take-Profit (TP): 75.060 (next major support level)
🔑 Technical Overview:
Previous Resistance Zones: 86.800 & 85.000
ChoCH Level: 82.500 (broken, triggering bearish continuation)
Liquidity Zone: Awaiting buildup before entering with confirmation
📉 Fundamental Outlook:
Fundamental Outlook:
The New Zealand Dollar (NZD) remains under pressure as the Reserve Bank of New Zealand (RBNZ) recently signaled a pause in rate hikes, dampening investor confidence. Adding to the bearish sentiment are weakening economic indicators, such as declining business confidence and softer retail spending. The global risk-off sentiment is also weighing on risk-sensitive currencies like the NZD.
On the other hand, the Japanese Yen (JPY) is gaining strength amid a gradually hawkish shift by the Bank of Japan (BOJ), signaling potential tightening in monetary policy. The Yen is also supported by increased safe-haven demand due to rising geopolitical tensions and global economic uncertainty. Additionally, recent data pointing to higher inflation and wage growth in Japan further strengthens the case for a bullish JPY outlook.
📌 Disclaimer:
This analysis is for informational and educational purposes only and should not be considered financial advice. Trading involves substantial risk, and past performance is not indicative of future results. Always conduct your own research and consult with a financial professional before making any investment decisions.

nzdjpy sell / shortBy utilizing levels, historical patterns, , we can formulate a hypothesis that the market might follow a similar trajectory if bullish sentiment prevails.
